Advertisement
- United States
- /
- Oil and Gas
- /
- NYSE:EQT
EQT Stock: Assessing the Value After a 45% Surge and Natural Gas Expansion

Simply Wall St
Reviewed by Bailey Pemberton
Thinking about what to do with EQT stock right now? It’s a classic question many investors are wrestling with, especially after seeing shares notch a remarkable 13.4% gain so far this year and an eye-popping 276.4% return over the past five years. Despite a slight dip of 0.7% both over the last week and the last month, EQT is still riding high, and it’s easy to see why people are giving it a serious look. That kind of long-term performance stands out, and, if you zoom out, the company’s latest moves have only added to the buzz.
Recent headlines have kept EQT in the spotlight. Its ongoing drive to expand natural gas operations and focus on innovation in energy infrastructure have positioned EQT as a potential leader for the next stage of growth in energy markets. Investors seem to have taken notice, and the market’s overall perception of risk appears to be shifting, reflected in the stock’s robust one-year gain of 45.2%.
When it comes to whether EQT is a bargain right now, it’s not just a gut call; there are actual numbers behind the story. Based on six key valuation checks, EQT scores a 4. That means it passes four out of six measures for being undervalued, which is a compelling starting point. But how do those individual valuation approaches stack up, and is there an even more insightful way to judge the stock's true worth? Let’s dig deeper into each method before concluding with a smarter perspective on stock valuation.
Approach 1: EQT Discounted Cash Flow (DCF) Analysis
The Discounted Cash Flow (DCF) model works by forecasting a company’s future cash flows and then discounting those expected amounts back to their present value, helping investors estimate what the business is truly worth today. For EQT, this method uses projections of Free Cash Flow (FCF), which is the cash a company generates after essential expenses and investments.
EQT’s latest available Free Cash Flow is $2.13 billion. Analysts project that, over the coming years, this figure will continue to climb, with forecasts reaching $3.86 billion in 2026 and peaking at $4.24 billion by 2027. Beyond that, the projections begin to taper, with FCF eventually declining to roughly $2.65 billion by 2029. Notably, after those years, any further figures are based on extrapolations, not direct analyst estimates, but the general uptrend in the near term is clear.
Using these forecasts, the DCF model calculates an intrinsic value for EQT of $83.31 per share. Compared to the current market price, this represents a 35.5% discount, indicating the stock is significantly undervalued at current levels.
Result: UNDERVALUED
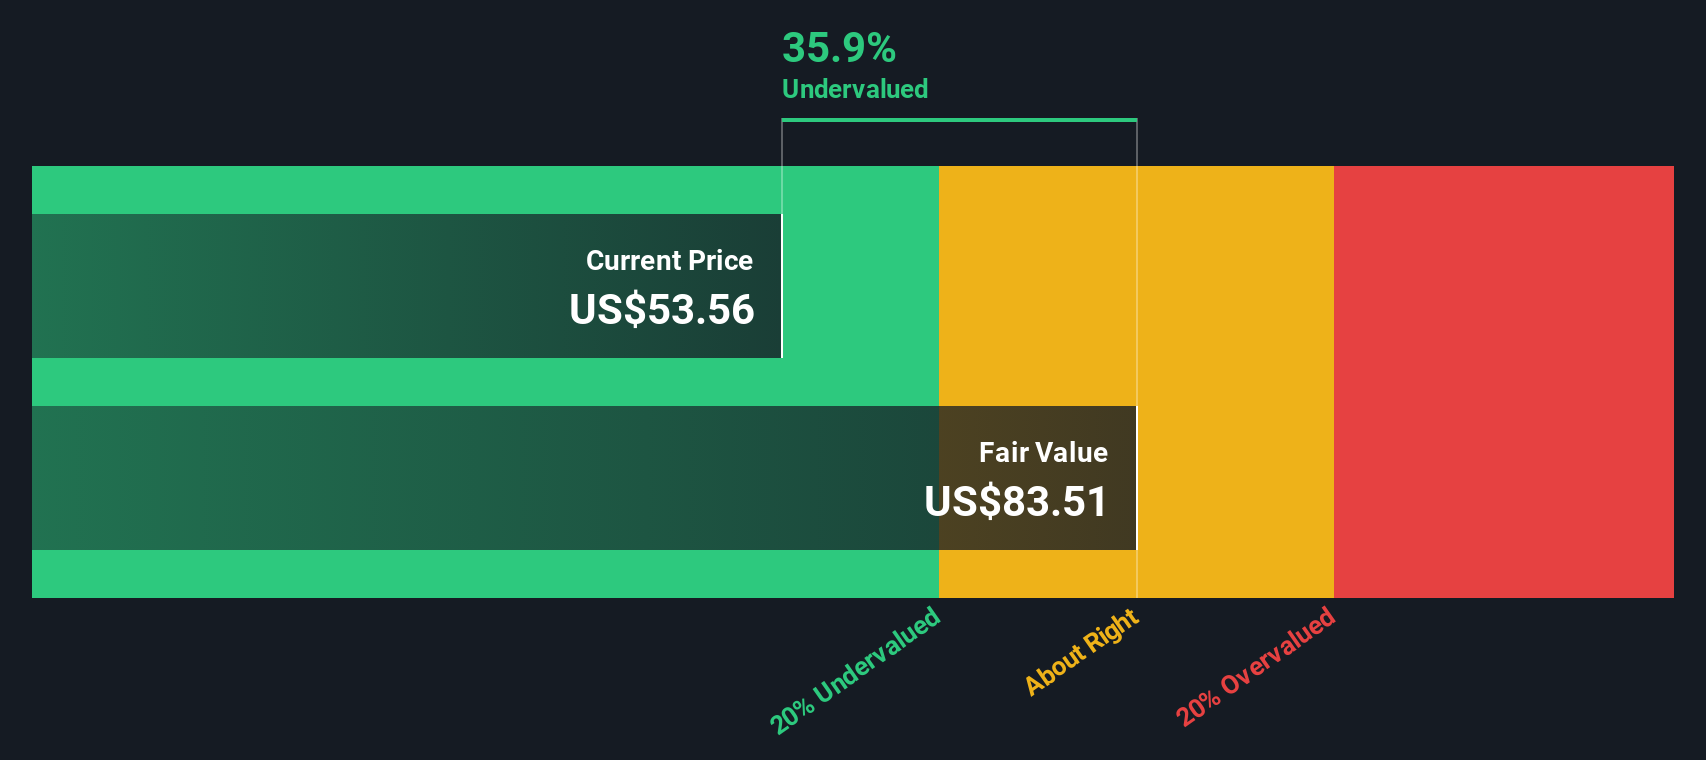
Our Discounted Cash Flow (DCF) analysis suggests EQT is undervalued by 35.5%. Track this in your watchlist or portfolio, or discover more undervalued stocks.
Approach 2: EQT Price vs Earnings (PE Ratio)
For profitable companies like EQT, the Price-to-Earnings (PE) ratio is a go-to valuation metric. It tells investors how much they are paying for each dollar of the company’s earnings, which is particularly helpful in understanding if a stock is expensive or a bargain relative to its actual profit generation.
Typically, growth expectations and risk levels are big factors in deciding what’s a “normal” or “fair” PE ratio for a stock. Higher growth potential or lower risk generally commands a higher multiple, while the opposite is true for slower-growing or riskier businesses.
Right now, EQT trades at a PE ratio of 18.82x. For context, the average among its direct peers is 37.13x, and the broad Oil and Gas industry average is noticeably lower at 12.80x. This positions EQT above the industry benchmark but well below the peer group.
This is where Simply Wall St’s “Fair Ratio” comes in. EQT’s Fair PE Ratio stands at 20.79x, calculated using not just raw numbers, but factoring in the company’s earnings growth outlook, profit margins, industry norms, size, and risk profile. This approach provides a much more tailored benchmark than straight comparisons with peers or the industry, which can miss nuances like market cap or varying risk levels.
Comparing EQT’s actual PE (18.82x) to its Fair Ratio (20.79x), the stock appears slightly undervalued based on its financials and prospects, but the difference is not significant. This suggests it is priced about right given everything in play.
Result: ABOUT RIGHT

PE ratios tell one story, but what if the real opportunity lies elsewhere? Discover companies where insiders are betting big on explosive growth.
Upgrade Your Decision Making: Choose your EQT Narrative
Earlier we mentioned there’s an even better way to understand valuation, so let’s introduce you to Narratives, a smarter, more dynamic approach to investing available to millions of users on Simply Wall St’s Community page.
A Narrative is your story or viewpoint on EQT, combining your assumptions, such as future revenue, margins, and fair value, with what's happening in the real world. This approach turns raw financials into a clear, actionable investment outlook. Narratives make it easy for investors to connect the company’s latest developments, analyst forecasts, or breaking news with its true worth. By showing how changes in financial forecasts directly affect the fair value compared to the share price, Narratives can help inform decisions about the timing of your investments.
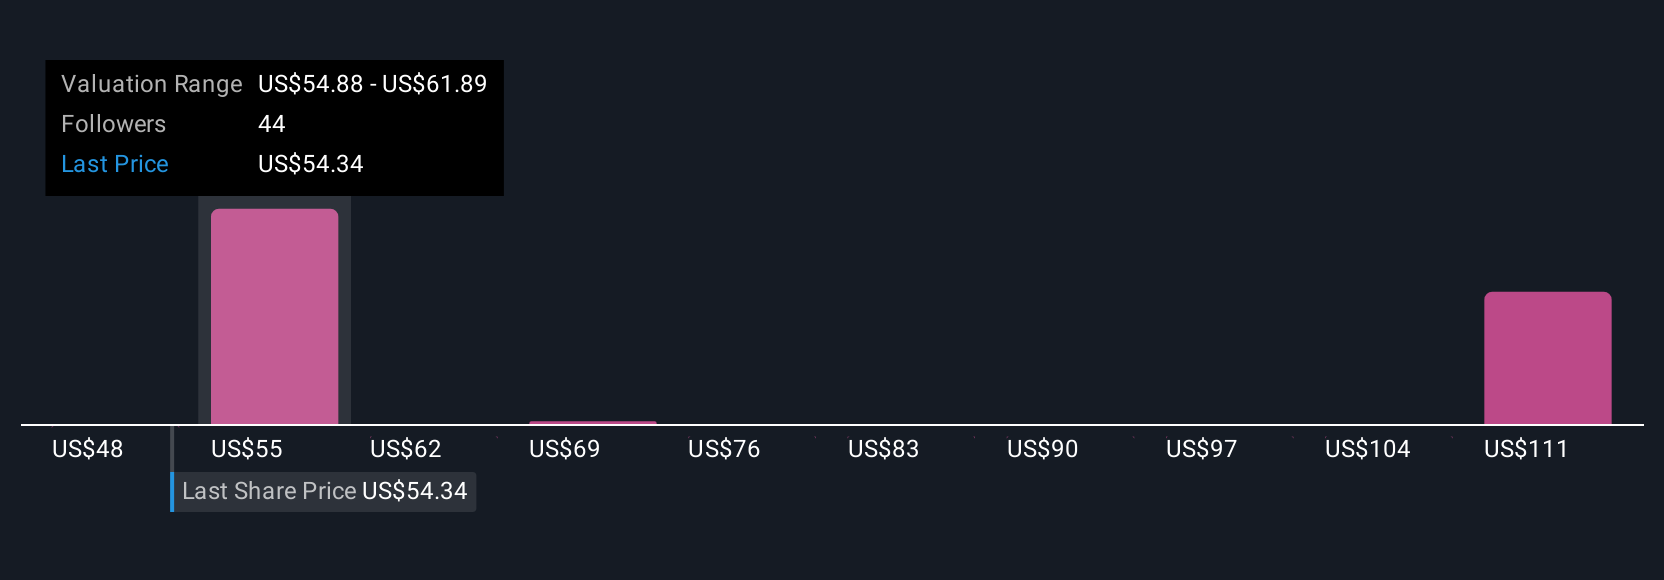
The best part is that Narratives automatically update as new data or news comes in, so your view stays relevant and current without extra effort. For example, some investors see EQT’s robust infrastructure investments and demand from data centers driving a fair value as high as $80, while others highlight regulatory and commodity risks and set targets as low as $42, all tied to their unique forecast assumptions. Narratives let you compare these perspectives side by side and create your own, empowering you to invest with conviction and clarity.
Do you think there's more to the story for EQT? Create your own Narrative to let the Community know!
This article by Simply Wall St is general in nature. We provide commentary based on historical data and analyst forecasts only using an unbiased methodology and our articles are not intended to be financial advice. It does not constitute a recommendation to buy or sell any stock, and does not take account of your objectives, or your financial situation. We aim to bring you long-term focused analysis driven by fundamental data. Note that our analysis may not factor in the latest price-sensitive company announcements or qualitative material. Simply Wall St has no position in any stocks mentioned.
Valuation is complex, but we're here to simplify it.
Discover if EQT might be undervalued or overvalued with our detailed analysis, featuring fair value estimates, potential risks, dividends, insider trades, and its financial condition.
Access Free AnalysisHave feedback on this article? Concerned about the content? Get in touch with us directly. Alternatively, email editorial-team@simplywallst.com
About NYSE:EQT
EQT
Engages in the production, gathering, and transmission of natural gas.
Solid track record and good value.
Similar Companies
Market Insights

Advertisement
Community Narratives
Finding The True Value Of A Logistics Powerhouse
Fair Value US$95.21|8.4% undervalued
NV
Community Contributor
Paradigm Biopharmaceuticals Will Lead Osteoarthritis Treatment with Zilosul's FDA Success
Fair Value AU$5.50|92.1% undervalued
AM
Community Contributor
Barrick Mining (ABX:CA): A Gold Hedge against a U.S. Shutdown
Fair Value CA$60.00|24.2% undervalued
GM
Community Contributor