Advertisement
- United States
- /
- Oil and Gas
- /
- NYSE:EOG
Is There Now an Opportunity in EOG Resources After 14.8% Year-to-Date Slide in 2025?

Simply Wall St
Reviewed by Bailey Pemberton
If you're wondering what to do with your EOG Resources shares after a bumpy stretch for oil stocks, you're not alone. With the stock closing recently at $106.21, it’s natural to ask whether the latest market moves represent a buying opportunity or a signal to stay cautious. EOG’s stock has seen a pullback, down 2.2% over the past week and off 8.0% in the past month. Year-to-date, the slide sits at 14.8%, and even the 1-year return is negative at -11.9%. Yet, if you zoom out a bit, things start to look much more optimistic: EOG’s five-year performance still clocks in at an impressive 315.8% return for long-term holders.
These recent declines have come alongside broader energy sector moderation and shifting investor sentiment around crude oil demand and global supply. At the same time, EOG has maintained a reputation for operational strength and capital discipline, which continues to attract attention from value-focused investors. Any headlines about shifting OPEC strategies or geopolitical developments can jolt the price in the near term, but they do not tell the full story of the company’s underlying worth.
That core value is reflected in EOG’s latest valuation score: a perfect 6 out of 6, meaning the company screens as undervalued by every major metric in our checklist. So, is the market missing something, or is there genuine cause for concern? Let’s break down how EOG stacks up against several proven valuation methods, and then explore a more holistic approach to judging whether it really deserves your confidence for the long haul.
Why EOG Resources is lagging behind its peers
Approach 1: EOG Resources Discounted Cash Flow (DCF) Analysis
The Discounted Cash Flow (DCF) model estimates a company's true value by projecting future cash flows and discounting them back to today, reflecting what the business is worth in present terms. For EOG Resources, this involves taking its current Free Cash Flow and forecasting its trajectory over the next decade using analyst estimates and further extrapolations.
As of the latest trailing twelve months, EOG's Free Cash Flow stands at $4.86 billion. Analyst projections indicate steady growth, with Free Cash Flow expected to reach $5.78 billion by 2029. Beyond 2029, conservative growth rates are applied, leading to a projected Free Cash Flow of $7.24 billion by 2035. All values are stated in US dollars.
Based on these multi-year projections and discounting them to reflect today's dollar value, the DCF analysis suggests EOG's fair value should be $268.93 per share. With the stock currently trading at $106.21, the market price represents a 60.5% discount to this estimated intrinsic value, highlighting considerable undervaluation based on cash flow potential.
Result: UNDERVALUED
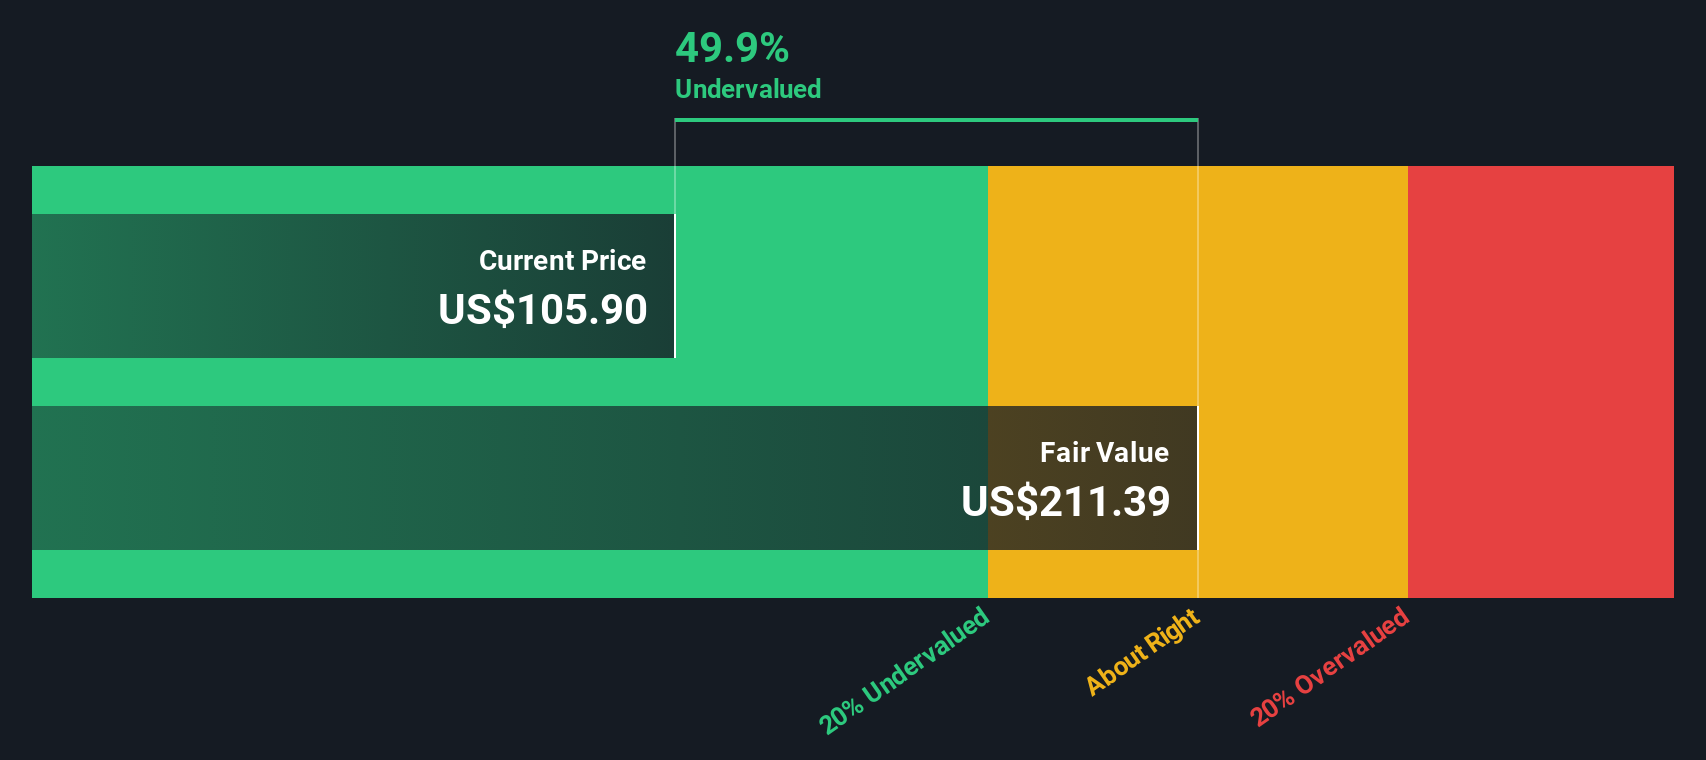
Our Discounted Cash Flow (DCF) analysis suggests EOG Resources is undervalued by 60.5%. Track this in your watchlist or portfolio, or discover more undervalued stocks.
Approach 2: EOG Resources Price vs Earnings
For profitable companies like EOG Resources, the price-to-earnings (PE) ratio is a widely recognized way to value stocks. It tells investors how much they are paying for each dollar of a company’s earnings. Because the oil and gas sector can exhibit cyclical profits, PE ratios help investors assess whether a stock is cheap or expensive relative to its recent profitability and future earnings potential.
It is important to note that what counts as a “normal” or “fair” PE ratio varies depending on expectations for growth and risk. Faster-growing businesses or those with more stable earnings can justify higher PE multiples; on the other hand, companies facing headwinds or volatile earnings usually trade at lower ratios.
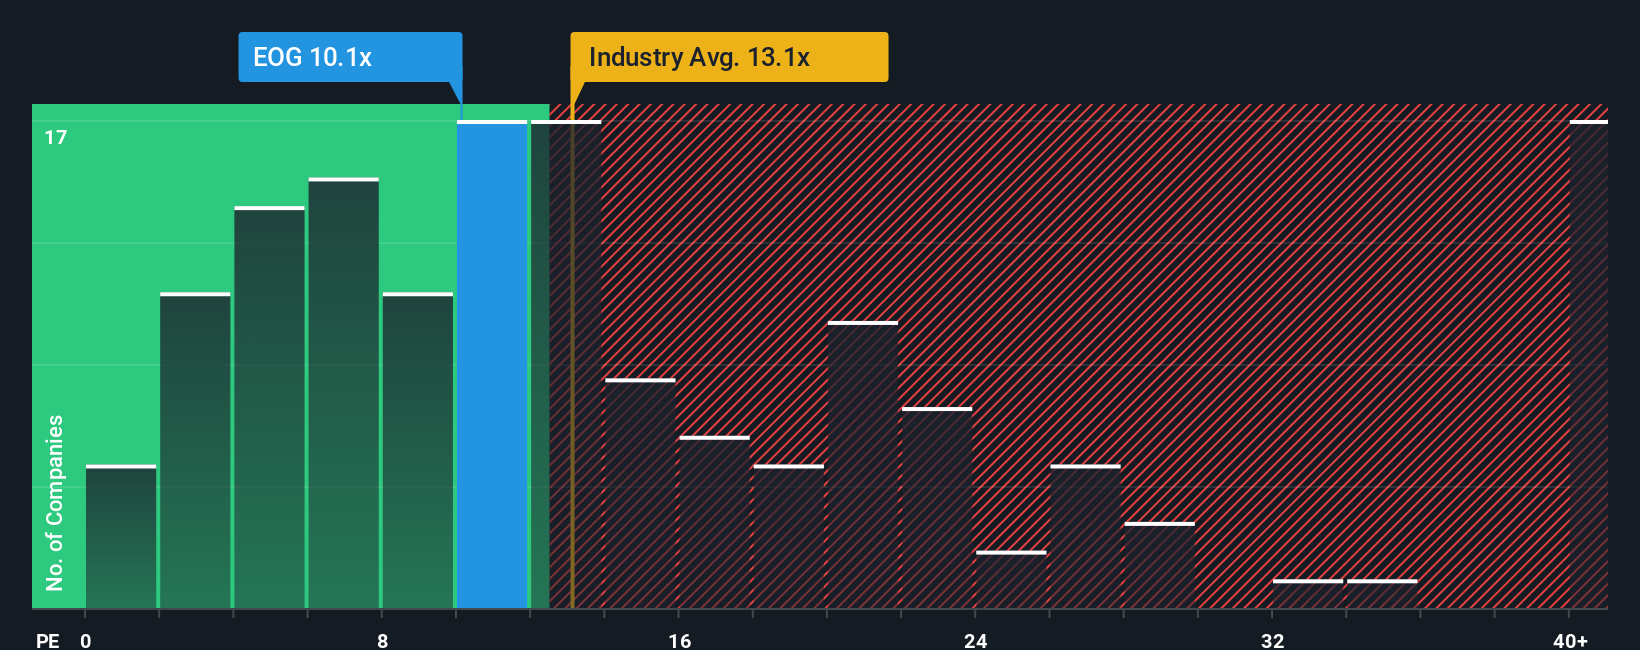
Currently, EOG Resources trades at a PE ratio of 10.1x. This is below both the industry average PE of 12.9x and the peer average of 12.2x, suggesting it is valued more conservatively by the market. A more meaningful comparison is with Simply Wall St’s “Fair Ratio,” which for EOG is 19.0x. Unlike a straight industry or peer comparison, the Fair Ratio factors in EOG’s unique blend of earnings growth potential, profit margins, risk profile, market cap, and sector outlook. This nuanced approach provides a more accurate sense of whether the current valuation makes sense.
With EOG’s actual PE ratio of 10.1x sitting well below the Fair Ratio of 19.0x, the shares appear notably undervalued when viewed from this perspective.
Result: UNDERVALUED
PE ratios tell one story, but what if the real opportunity lies elsewhere? Discover companies where insiders are betting big on explosive growth.
Upgrade Your Decision Making: Choose your EOG Resources Narrative
Earlier we mentioned that there is an even better way to understand valuation, so let’s introduce you to Narratives, a powerful and easy framework that lets investors go beyond raw numbers by linking EOG’s story and future assumptions to a financial forecast and fair value.
A Narrative is simply your perspective on the company’s potential, connecting what you believe about EOG’s business (such as operational strategy, market opportunities, or possible risks) with your own estimates of its future revenue, earnings, and margins. This ultimately expresses your view as a fair value per share.
Rather than relying purely on traditional metrics, Narratives give you a dynamic way to visualize how your expectations (or those of the broader community) measure up against the stock’s current price. This helps clarify when it might be time to buy or sell.
This user-friendly tool is available on Simply Wall St’s Community page and is trusted by millions of investors. Best of all, Narratives are automatically updated whenever new data such as news, earnings, or guidance emerges.
For example, investors with a bullish Narrative on EOG Resources might project industry-leading synergies and operational efficiency, supporting a price target of $170. The most cautious may focus on sector risks and future margin pressures, resulting in a price target closer to $120. This demonstrates how Narratives help you tailor your investment decision to your own outlook and the latest facts.
Do you think there's more to the story for EOG Resources? Create your own Narrative to let the Community know!

This article by Simply Wall St is general in nature. We provide commentary based on historical data and analyst forecasts only using an unbiased methodology and our articles are not intended to be financial advice. It does not constitute a recommendation to buy or sell any stock, and does not take account of your objectives, or your financial situation. We aim to bring you long-term focused analysis driven by fundamental data. Note that our analysis may not factor in the latest price-sensitive company announcements or qualitative material. Simply Wall St has no position in any stocks mentioned.
Valuation is complex, but we're here to simplify it.
Discover if EOG Resources might be undervalued or overvalued with our detailed analysis, featuring fair value estimates, potential risks, dividends, insider trades, and its financial condition.
Access Free AnalysisHave feedback on this article? Concerned about the content? Get in touch with us directly. Alternatively, email editorial-team@simplywallst.com
About NYSE:EOG
EOG Resources
Explores for, develops, produces, and markets crude oil, natural gas liquids, and natural gas in producing basins in the United States, the Republic of Trinidad and Tobago, and internationally.
Very undervalued with excellent balance sheet and pays a dividend.
Similar Companies
Market Insights

Advertisement
Community Narratives
The company that turned a verb into a global necessity and basically runs the modern internet, digital ads, smartphones, maps, and AI.
Fair Value US$300.00|10.8% undervalued
OS
Community Contributor
Flowers Foods Pays A Fair Price For Health
Fair Value US$16.12|22.0% undervalued
NV
Community Contributor
TMX Group will thrive with 33.3% profit margin and enduring market moat
Fair Value CA$49.90|3.8% overvalued
LI
Community Contributor