Advertisement
- United States
- /
- Oil and Gas
- /
- NYSE:CQP
Cheniere Energy Partners (CQP): Assessing Valuation After $1 Billion Debt Offer and Analyst Downgrades

Simply Wall St
Reviewed by Simply Wall St
Cheniere Energy Partners (CQP) has caught investors’ attention following its announcement of a $1 billion fixed-income exchange offer for senior unsecured notes due in 2035. Recent analyst actions, along with this move, are shaping market sentiment.
See our latest analysis for Cheniere Energy Partners.
Cheniere Energy Partners’ share price has edged lower in recent sessions, with a 1-day decline of 1.26% and a 7-day drop of 2.47%. The recent fixed-income exchange offer and mixed analyst reactions seem to have weighed on sentiment, though the company’s one-year total shareholder return remains positive at 1.95%. Momentum looks muted in the short term. However, long-term investors have seen a robust 90.10% total return over five years.
Curious about other compelling opportunities? Now’s the perfect moment to explore the market’s fast movers. Discover fast growing stocks with high insider ownership
With muted momentum and recent analyst caution despite solid long-term returns, investors face a crossroads. Is Cheniere Energy Partners undervalued after its bond offer and price dip, or is the market accurately pricing in future growth?
Price-to-Earnings of 13.7x: Is it justified?
Cheniere Energy Partners’ latest close of $52.51 comes at a price-to-earnings (P/E) ratio of 13.7x, which appears slightly expensive compared to the broader US Oil and Gas industry, currently averaging 13.1x. However, when measured against its peer average of 15.6x, CQP’s valuation looks a bit more favorable.
The P/E ratio compares a company's share price to its per-share earnings, showing how much investors are willing to pay for a dollar of profit. In capital-intensive sectors like energy, this metric can also reflect investor expectations about future earnings stability and growth.
At 13.7x, the market is pricing Cheniere Energy Partners higher than the average energy competitor, but this multiple remains below the peer group’s average and is significantly less than the estimated SWS fair P/E of 17.3x. This suggests there could be room for the market to adjust upward if confidence in the company increases.
Result: Price-to-Earnings of 13.7x (ABOUT RIGHT)
Explore the SWS fair ratio for Cheniere Energy Partners
However, slowing revenue growth and recent price declines could limit upside if earnings momentum does not improve or if market sentiment remains cautious.
Find out about the key risks to this Cheniere Energy Partners narrative.
Another View: What Does the DCF Model Show?
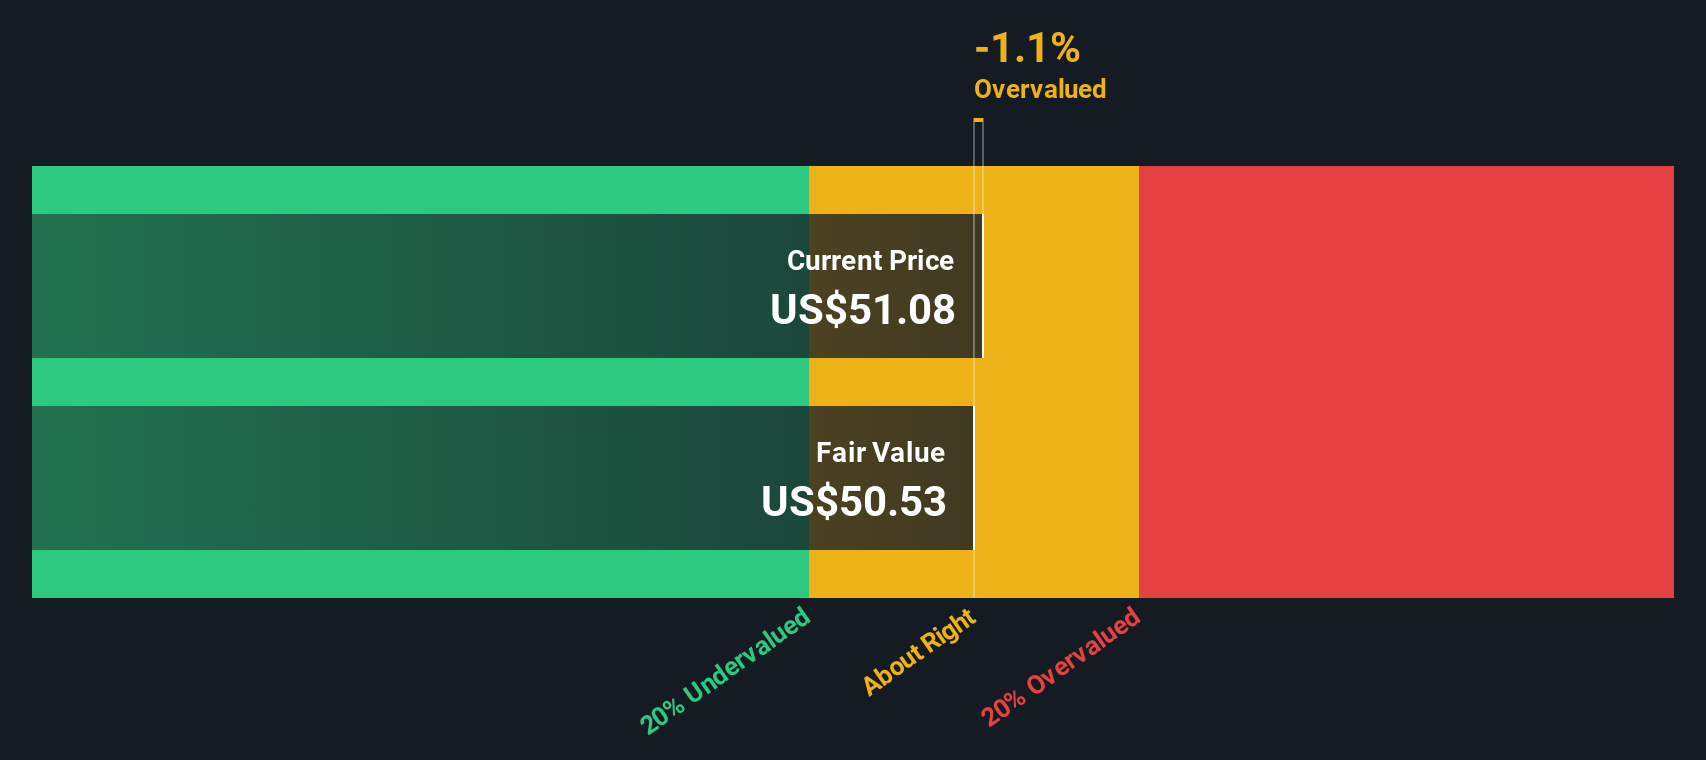
Taking a different approach, our SWS DCF model values Cheniere Energy Partners at $50.31, while the market price sits higher at $52.51. This suggests shares may be a bit overvalued using a long-term cash flow lens. Could the gap signal caution for those banking on future growth projections?
Look into how the SWS DCF model arrives at its fair value.
Simply Wall St performs a discounted cash flow (DCF) on every stock in the world every day (check out Cheniere Energy Partners for example). We show the entire calculation in full. You can track the result in your watchlist or portfolio and be alerted when this changes, or use our stock screener to discover 928 undervalued stocks based on their cash flows. If you save a screener we even alert you when new companies match - so you never miss a potential opportunity.
Build Your Own Cheniere Energy Partners Narrative
If you see things differently or want to dig deeper into the numbers yourself, it only takes a few minutes to create your own perspective. Do it your way
A great starting point for your Cheniere Energy Partners research is our analysis highlighting 2 key rewards and 3 important warning signs that could impact your investment decision.
Ready for Your Next Smart Move?
Do not let your next big winner slip through the cracks. Handpicked screeners on Simply Wall St can help you spot emerging opportunities you might otherwise miss.
- Pounce on income potential and uncover steady earners with these 16 dividend stocks with yields > 3%, which offers yields above 3%.
- Get ahead of tomorrow's breakthroughs by scanning these 26 AI penny stocks and spotting innovators in artificial intelligence who are poised to disrupt entire sectors.
- Zero in on future market leaders by assessing these 928 undervalued stocks based on cash flows, identifying stocks trading below their true value and considered primed for upside.
This article by Simply Wall St is general in nature. We provide commentary based on historical data and analyst forecasts only using an unbiased methodology and our articles are not intended to be financial advice. It does not constitute a recommendation to buy or sell any stock, and does not take account of your objectives, or your financial situation. We aim to bring you long-term focused analysis driven by fundamental data. Note that our analysis may not factor in the latest price-sensitive company announcements or qualitative material. Simply Wall St has no position in any stocks mentioned.
New: AI Stock Screener & Alerts
Our new AI Stock Screener scans the market every day to uncover opportunities.
• Dividend Powerhouses (3%+ Yield)
• Undervalued Small Caps with Insider Buying
• High growth Tech and AI Companies
Or build your own from over 50 metrics.
Have feedback on this article? Concerned about the content? Get in touch with us directly. Alternatively, email editorial-team@simplywallst.com
About NYSE:CQP
Cheniere Energy Partners
Through its subsidiaries, provides liquefied natural gas (LNG) to integrated energy companies, utilities, and energy trading companies in the United States and internationally.
Established dividend payer with low risk.
Similar Companies
Market Insights

Advertisement
Community Narratives
MicroVision will explode future revenue by 380.37% with a vision towards success
Fair Value US$60.00|98.4% undervalued
TH
Community Contributor
The Indispensable Artery for a New North American Economy
Fair Value CA$132.87|1.3% undervalued
TI
Community Contributor