Advertisement
- United States
- /
- Diversified Financial
- /
- OTCPK:FNMA
Fannie Mae (FNMA) Returns to Profitability, But Steep Earnings Decline Forecast Challenges Bullish Narratives

Simply Wall St
Reviewed by Simply Wall St
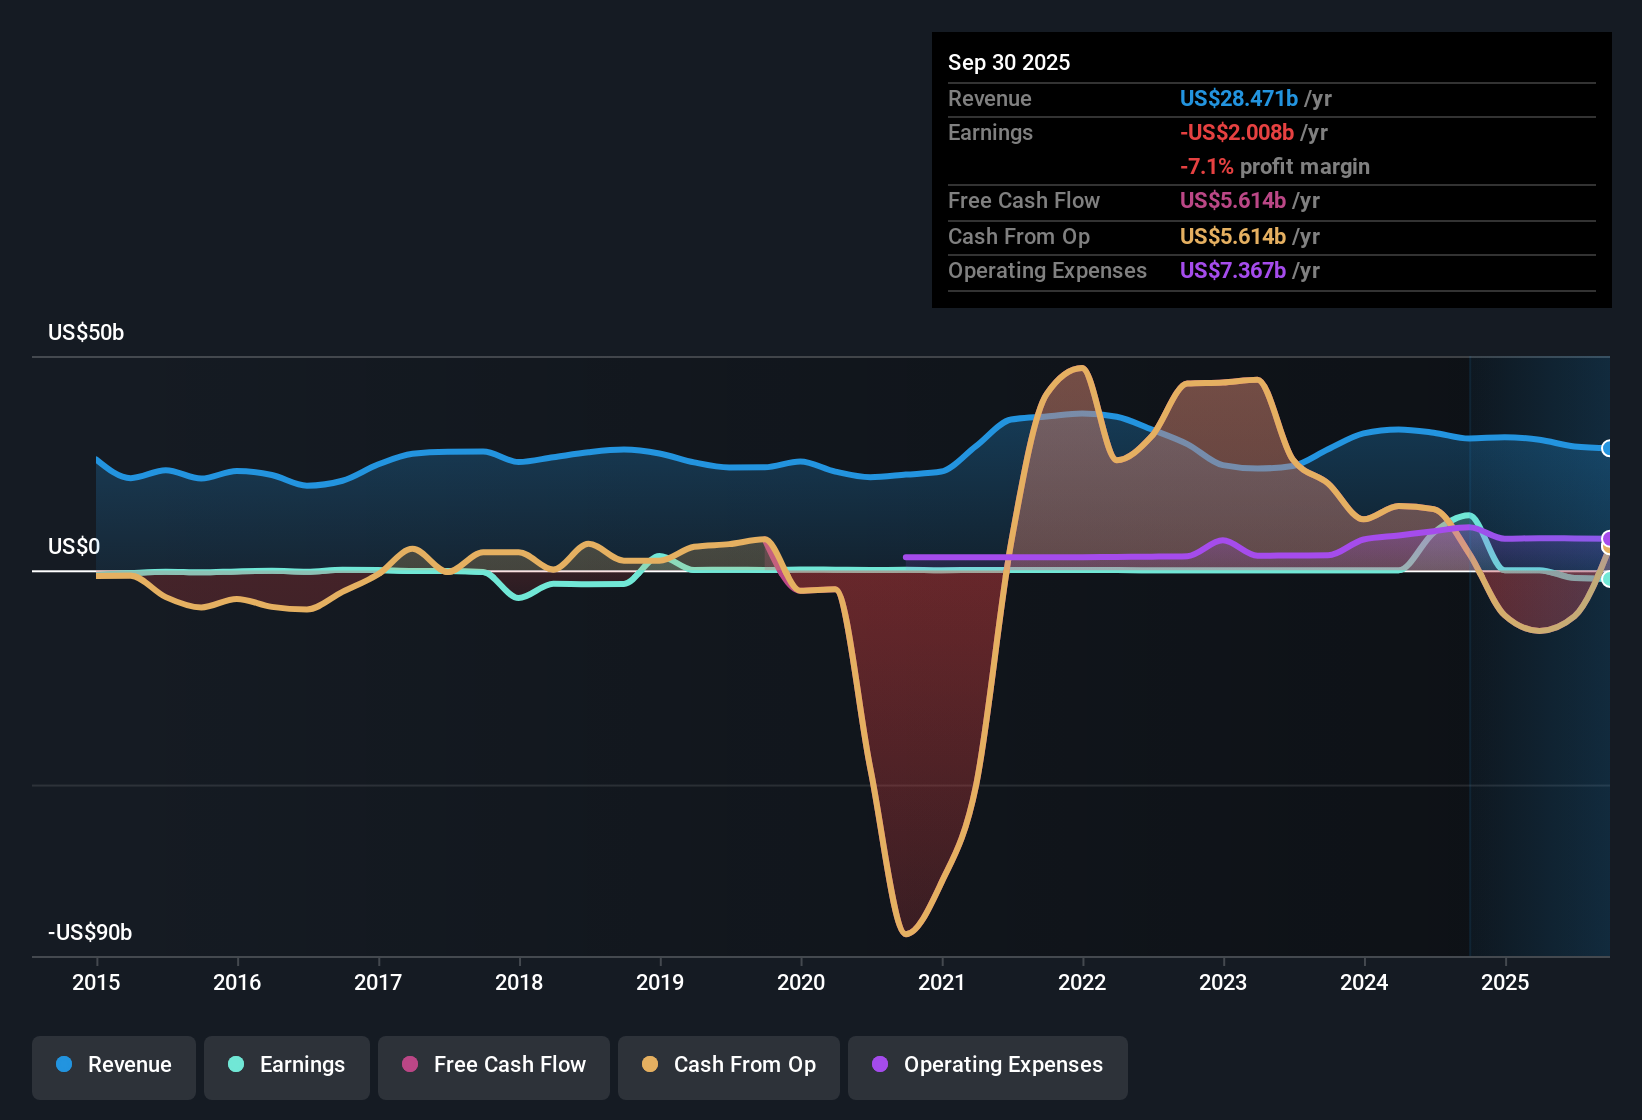
Federal National Mortgage Association (FNMA) returned to profitability in the past year, as its net profit margin improved and 5-year earnings growth reached an impressive 100.3% per year. However, forecasts now call for a sharp reversal, with earnings expected to drop by 118.4% annually for the next three years. Despite the profit turnaround, investors face a mixed picture, as revenue is projected to grow just 3.2% annually compared to the broader US market's 10.3% growth, and the share price stands at $10.52, which is significantly higher than the modeled fair value estimate of $2. This combination of strong past growth and a challenging outlook sets the stage for a divisive earnings season.
See our full analysis for Federal National Mortgage Association.Next up, let’s see how the latest numbers stack up against the prevailing narratives. Some market views may be reinforced, while others could face a reality check.
Curious how numbers become stories that shape markets? Explore Community Narratives
High Margins Meet Cautious Profit Outlook
- Net profit margin turned positive over the past year, and is now high compared to prior periods, signaling improved earnings quality.
- Market observers note that, while FNMA’s recent return to profitability gives bulls something to cheer about, forecasts call for a steep reversal, with earnings expected to fall by 118.4% per year over the next three years.
- This projection challenges optimism about the margin rebound and spotlights the disconnect between strong current figures and management's downbeat guidance.
- High profit margins make the negative outlook for earnings even more notable, especially as sustained profitability remains at risk.
Valuation Discount but Premium to DCF Model
- FNMA trades at a price-to-earnings ratio of 5.6x, significantly below its peer group (33.2x) and the broader financial sector (15.1x), but the share price at $10.52 is over five times the DCF fair value estimate of $2.00.
- The prevailing market view highlights a valuation tug-of-war between bears who may point to the sharp premium above DCF fair value as a reason for caution, and bulls who could argue that the discount to industry P/E multiples offsets some downside.
- The share price standing well above modeled fair value may restrict further upside absent a major shift in fundamental prospects.
- A low P/E ratio signals undervaluation relative to peers but does not automatically outweigh the weak outlook in the near term.
Revenue Growth Lags Sector Leaders
- Annual revenue growth is projected at just 3.2%, much slower than the 10.3% expected across the wider US market.
- The prevailing market view emphasizes that FNMA’s modest top-line expansion could limit its ability to keep pace with market leaders, even if more bullish scenarios around GSE reform gain traction.
- The gap in growth rates reinforces the headwind FNMA faces as investors gravitate toward faster-growing peers.
- Laggard revenue momentum may dilute the impact of any positive margin surprises if the sector continues to outpace FNMA.
See what the community is saying about Federal National Mortgage Association
See what the community is saying about Federal National Mortgage AssociationNext Steps
Don't just look at this quarter; the real story is in the long-term trend. We've done an in-depth analysis on Federal National Mortgage Association's growth and its valuation to see if today's price is a bargain. Add the company to your watchlist or portfolio now so you don't miss the next big move.
See What Else Is Out There
Despite Federal National Mortgage Association's improved margins, it faces weak near-term earnings prospects, a slow revenue growth outlook, and trades above its estimated fair value.
Looking for more compelling value opportunities? Use these 848 undervalued stocks based on cash flows to quickly spot stocks trading below their intrinsic worth and sidestep overhyped risks.
This article by Simply Wall St is general in nature. We provide commentary based on historical data and analyst forecasts only using an unbiased methodology and our articles are not intended to be financial advice. It does not constitute a recommendation to buy or sell any stock, and does not take account of your objectives, or your financial situation. We aim to bring you long-term focused analysis driven by fundamental data. Note that our analysis may not factor in the latest price-sensitive company announcements or qualitative material. Simply Wall St has no position in any stocks mentioned.
New: AI Stock Screener & Alerts
Our new AI Stock Screener scans the market every day to uncover opportunities.
• Dividend Powerhouses (3%+ Yield)
• Undervalued Small Caps with Insider Buying
• High growth Tech and AI Companies
Or build your own from over 50 metrics.
Have feedback on this article? Concerned about the content? Get in touch with us directly. Alternatively, email editorial-team@simplywallst.com
About OTCPK:FNMA
Federal National Mortgage Association
Provides financing solutions for residential mortgages in the United States.
Fair value with acceptable track record.
Similar Companies
Market Insights

Advertisement
Community Narratives
The company that turned a verb into a global necessity and basically runs the modern internet, digital ads, smartphones, maps, and AI.
Fair Value US$300.00|6.2% undervalued
OS
Community Contributor
Flowers Foods Pays A Fair Price For Health
Fair Value US$16.12|25.1% undervalued
NV
Community Contributor
TMX Group will thrive with 33.3% profit margin and enduring market moat
Fair Value CA$49.90|0.04% overvalued
LI
Community Contributor