Stock Analysis
- United States
- /
- Consumer Finance
- /
- NYSE:SYF
Synchrony Financial (NYSE:SYF) shareholders have earned a 7.5% CAGR over the last five years

When you buy and hold a stock for the long term, you definitely want it to provide a positive return. Furthermore, you'd generally like to see the share price rise faster than the market. But Synchrony Financial (NYSE:SYF) has fallen short of that second goal, with a share price rise of 25% over five years, which is below the market return. Looking at the last year alone, the stock is up 5.8%.
So let's investigate and see if the longer term performance of the company has been in line with the underlying business' progress.
See our latest analysis for Synchrony Financial
While markets are a powerful pricing mechanism, share prices reflect investor sentiment, not just underlying business performance. One imperfect but simple way to consider how the market perception of a company has shifted is to compare the change in the earnings per share (EPS) with the share price movement.
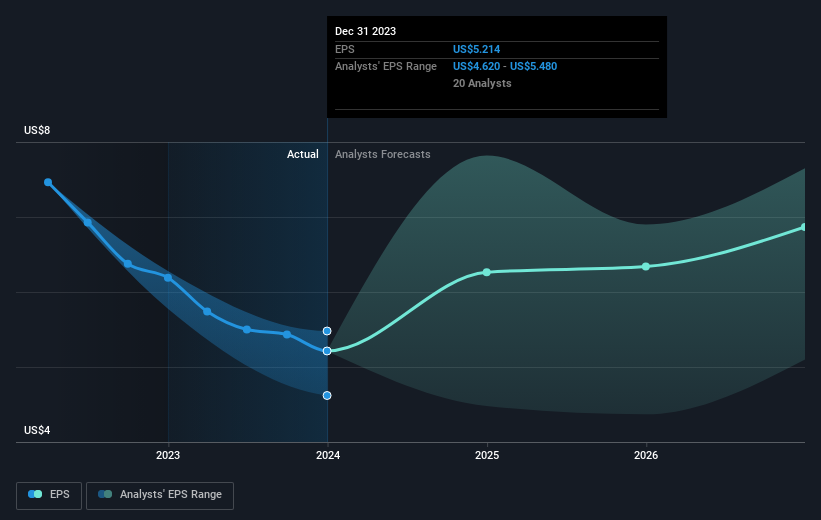
Over half a decade, Synchrony Financial managed to grow its earnings per share at 7.5% a year. This EPS growth is higher than the 5% average annual increase in the share price. So one could conclude that the broader market has become more cautious towards the stock. The reasonably low P/E ratio of 7.14 also suggests market apprehension.
The image below shows how EPS has tracked over time (if you click on the image you can see greater detail).
It is of course excellent to see how Synchrony Financial has grown profits over the years, but the future is more important for shareholders. Take a more thorough look at Synchrony Financial's financial health with this free report on its balance sheet.
What About Dividends?
It is important to consider the total shareholder return, as well as the share price return, for any given stock. The TSR incorporates the value of any spin-offs or discounted capital raisings, along with any dividends, based on the assumption that the dividends are reinvested. Arguably, the TSR gives a more comprehensive picture of the return generated by a stock. We note that for Synchrony Financial the TSR over the last 5 years was 43%, which is better than the share price return mentioned above. This is largely a result of its dividend payments!
A Different Perspective
Synchrony Financial shareholders are up 9.0% for the year (even including dividends). But that was short of the market average. The silver lining is that the gain was actually better than the average annual return of 7% per year over five year. This suggests the company might be improving over time. It's always interesting to track share price performance over the longer term. But to understand Synchrony Financial better, we need to consider many other factors. To that end, you should be aware of the 1 warning sign we've spotted with Synchrony Financial .
We will like Synchrony Financial better if we see some big insider buys. While we wait, check out this free list of growing companies with considerable, recent, insider buying.
Please note, the market returns quoted in this article reflect the market weighted average returns of stocks that currently trade on American exchanges.
Valuation is complex, but we're helping make it simple.
Find out whether Synchrony Financial is potentially over or undervalued by checking out our comprehensive analysis, which includes fair value estimates, risks and warnings, dividends, insider transactions and financial health.
View the Free AnalysisHave feedback on this article? Concerned about the content? Get in touch with us directly. Alternatively, email editorial-team (at) simplywallst.com.
This article by Simply Wall St is general in nature. We provide commentary based on historical data and analyst forecasts only using an unbiased methodology and our articles are not intended to be financial advice. It does not constitute a recommendation to buy or sell any stock, and does not take account of your objectives, or your financial situation. We aim to bring you long-term focused analysis driven by fundamental data. Note that our analysis may not factor in the latest price-sensitive company announcements or qualitative material. Simply Wall St has no position in any stocks mentioned.
About NYSE:SYF
Synchrony Financial
Synchrony Financial, together with its subsidiaries, operates as a consumer financial services company in the United States.
Undervalued with excellent balance sheet.

