Advertisement
- United States
- /
- Capital Markets
- /
- NYSE:SPGI
Assessing S&P Global’s (SPGI) Valuation Following Launch of Digital Markets 50 Index

Simply Wall St
Reviewed by Simply Wall St
S&P Global (NYSE:SPGI) has rolled out the S&P Digital Markets 50 Index, a new hybrid benchmark that tracks both cryptocurrencies and crypto-related stocks. This launch could spark the creation of new investment products and attract investors interested in digital assets.
See our latest analysis for S&P Global.
S&P Global has made several bold moves lately, from launching AI-powered document tools on Salesforce's AgentExchange to deepening its partnership with IBM to deliver cutting-edge supply chain analytics. This wave of innovation highlights the company's drive to stay ahead; however, the share price tells a more cautious story, with a year-to-date decline of 3.6% and a 1-year total shareholder return of -6.3%. Over the past three years, total returns are still an impressive 57%, suggesting the long-term momentum remains intact despite some recent volatility.
If the surge in fintech and digital markets has you interested in fresh opportunities, now is a smart moment to broaden your view and discover fast growing stocks with high insider ownership
Given S&P Global's recent innovations and mixed share performance, the key question is whether the current valuation underestimates the company's growth potential or if the market has already priced in its next moves. Could this be the moment to buy?
Price-to-Earnings of 36.3x: Is it justified?
S&P Global's current price-to-earnings ratio stands at 36.3x, noticeably higher than both its industry peers and estimated fair value. With a last close price of $477.59, the stock appears richly priced when compared to recent earnings figures and sector norms.
The price-to-earnings (P/E) ratio measures how much investors are willing to pay today for each dollar of future earnings. This metric is especially telling for established companies like S&P Global that show solid profit growth but may face tougher competition for expansion compared to younger disruptors.
S&P Global’s 36.3x P/E is well above the US Capital Markets industry average of 25.7x and significantly exceeds the company's estimated fair P/E of 20.2x. This hefty premium suggests the market anticipates continued outperformance or superior quality, but it may also signal over-optimism relative to longer-run earnings trends. If investor sentiment normalizes, the share price could realign closer to peer and fair multiple levels.
Explore the SWS fair ratio for S&P Global
Result: Price-to-Earnings of 36.3x (OVERVALUED)
However, slowing revenue growth or further market corrections could dampen optimism and challenge the view that S&P Global will maintain its current premium.
Find out about the key risks to this S&P Global narrative.
Another View: Discounted Cash Flow Offers a Cooler Take
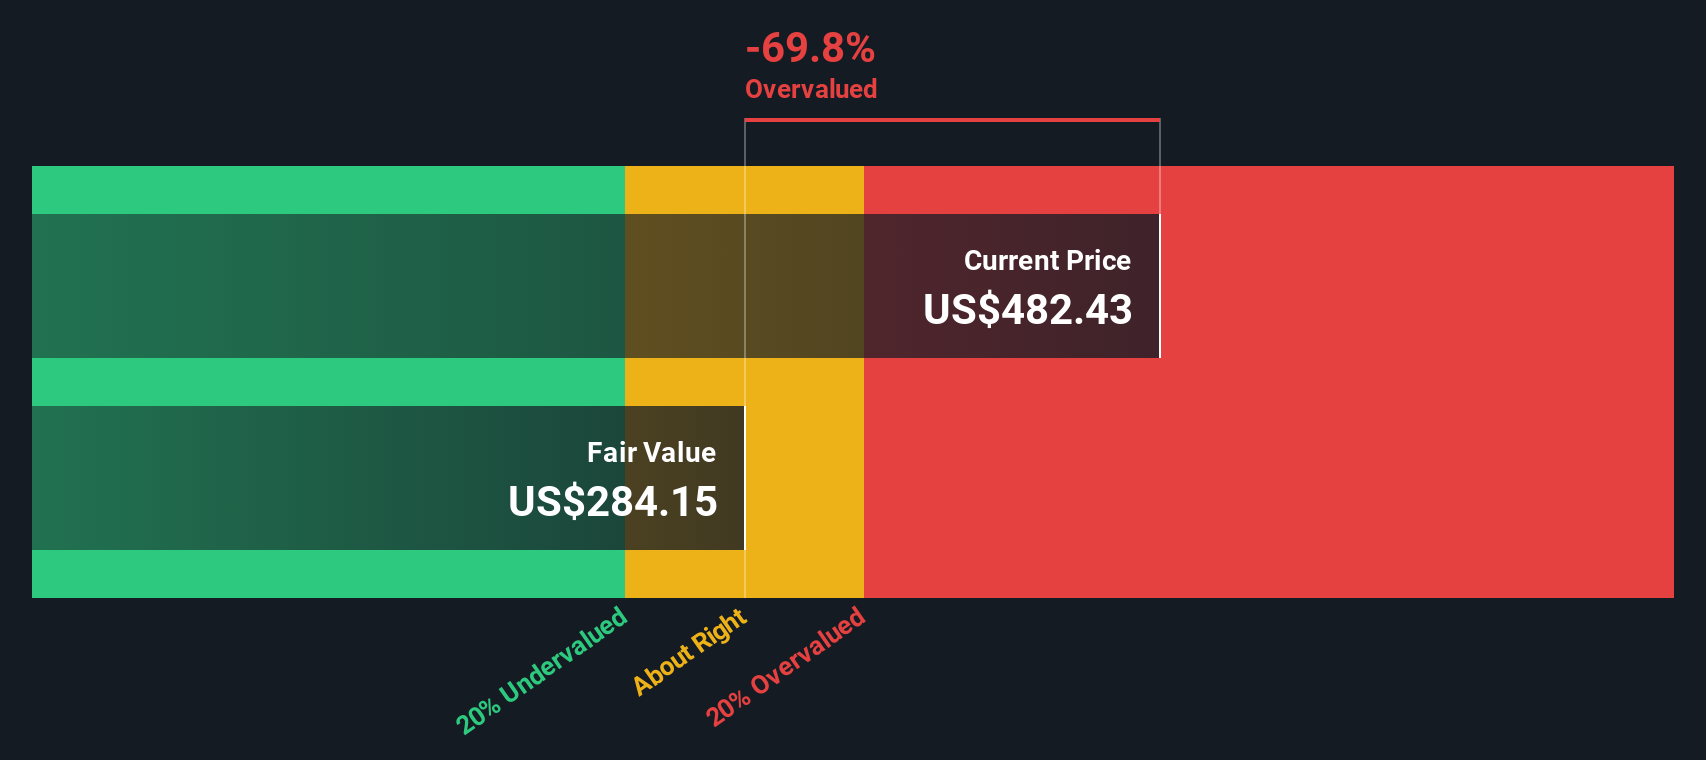
While the price-to-earnings ratio suggests S&P Global is pricey, our DCF model paints an even steeper divide. According to this model, the stock is valued at $288.29. This means it currently trades well above what future cash flows might justify. Does the premium truly match the future potential?
Look into how the SWS DCF model arrives at its fair value.
Simply Wall St performs a discounted cash flow (DCF) on every stock in the world every day (check out S&P Global for example). We show the entire calculation in full. You can track the result in your watchlist or portfolio and be alerted when this changes, or use our stock screener to discover undervalued stocks based on their cash flows. If you save a screener we even alert you when new companies match - so you never miss a potential opportunity.
Build Your Own S&P Global Narrative
If you see things differently or want to dig deeper, you can easily build your own perspective in just a few minutes, and Do it your way.
A great starting point for your S&P Global research is our analysis highlighting 3 key rewards and 1 important warning sign that could impact your investment decision.
Looking for More Investment Ideas?
Smart investors never limit themselves to a single opportunity. Take charge of your financial future by checking out the unique stocks and sectors shaping tomorrow's markets below.
- Capitalize on high yields and consistent returns with these 17 dividend stocks with yields > 3%, offering standout income plays for your portfolio.
- Seize the edge in healthcare innovation and transformative AI by checking out these 33 healthcare AI stocks before others catch on.
- Ride the next tech wave and see which leaders are disrupting industries by starting with these 24 AI penny stocks now.
This article by Simply Wall St is general in nature. We provide commentary based on historical data and analyst forecasts only using an unbiased methodology and our articles are not intended to be financial advice. It does not constitute a recommendation to buy or sell any stock, and does not take account of your objectives, or your financial situation. We aim to bring you long-term focused analysis driven by fundamental data. Note that our analysis may not factor in the latest price-sensitive company announcements or qualitative material. Simply Wall St has no position in any stocks mentioned.
New: Manage All Your Stock Portfolios in One Place
We've created the ultimate portfolio companion for stock investors, and it's free.
• Connect an unlimited number of Portfolios and see your total in one currency
• Be alerted to new Warning Signs or Risks via email or mobile
• Track the Fair Value of your stocks
Have feedback on this article? Concerned about the content? Get in touch with us directly. Alternatively, email editorial-team@simplywallst.com
About NYSE:SPGI
S&P Global
Provides credit ratings, benchmarks, analytics, and workflow solutions in the global capital, commodity, and automotive markets.
Solid track record with adequate balance sheet and pays a dividend.
Similar Companies
Market Insights

Advertisement
Community Narratives
Finding The True Value Of A Logistics Powerhouse
Fair Value US$95.21|8.4% undervalued
NV
Community Contributor
Paradigm Biopharmaceuticals Will Lead Osteoarthritis Treatment with Zilosul's FDA Success
Fair Value AU$5.50|92.1% undervalued
AM
Community Contributor
Barrick Mining (ABX:CA): A Gold Hedge against a U.S. Shutdown
Fair Value CA$60.00|24.2% undervalued
GM
Community Contributor