Advertisement
- United States
- /
- Capital Markets
- /
- NYSE:GAM
General American Investors (GAM): Exploring Valuation After CEO and Director Preferred Stock Purchases

Simply Wall St
Reviewed by Simply Wall St
General American Investors Company (GAM) caught investor attention after CEO Jeffrey W Priest and director Spencer Davidson each purchased thousands of shares in the company’s preferred stock. Insider buying such as this often sparks curiosity about management’s view on future prospects.
See our latest analysis for General American Investors Company.
General American Investors Company’s share price recently pulled back, but the 16% year-to-date price return and an impressive 27.7% total shareholder return over the past year point to a solid run. The latest momentum comes amid insider buying, which may signal leadership's optimism regarding the company’s direction. This is something long-term investors are likely watching closely given the stock’s 135% total return over five years.
If you want to look beyond the headlines and see what else stands out in today’s market, now’s a great time to discover fast growing stocks with high insider ownership
But does General American Investors Company’s recent insider activity and multi-year outperformance mean the shares are a bargain, or has the market already factored in any future growth potential, leaving little room for upside?
Price-to-Earnings of 7.2x: Is it justified?
General American Investors Company is trading at a price-to-earnings (P/E) ratio of 7.2x, which is significantly below the average P/E ratio of its peers (26.4x) and the broader US Capital Markets industry (23.8x). With a last close price of $58.74, the stock appears undervalued compared to industry benchmarks.
The P/E ratio measures how much investors are willing to pay per dollar of earnings. It is one of the most widely followed valuation tools for investment managers like General American. A below-average P/E can indicate the market is undervaluing the company's earnings potential, especially if fundamentals are stable or improving.
This notably low P/E suggests the market is not pricing in as much future growth or profitability as it does for competitors. Given the company's record of multi-year total returns and profitability growth, this raises questions about whether investors are underestimating its potential, or if caution is warranted given recent earnings volatility.
Compared to both peers and the industry, General American's valuation stands out. Its P/E ratio is far lower than sector norms, potentially positioning the stock as a value opportunity for investors seeking exposure to the capital markets segment.
See what the numbers say about this price — find out in our valuation breakdown.
Result: Price-to-Earnings of 7.2x (UNDERVALUED)
However, ongoing earnings volatility and uncertain revenue growth remain key risks that could challenge the undervalued thesis for General American Investors Company.
Find out about the key risks to this General American Investors Company narrative.
Another View: Discounted Cash Flow Perspective
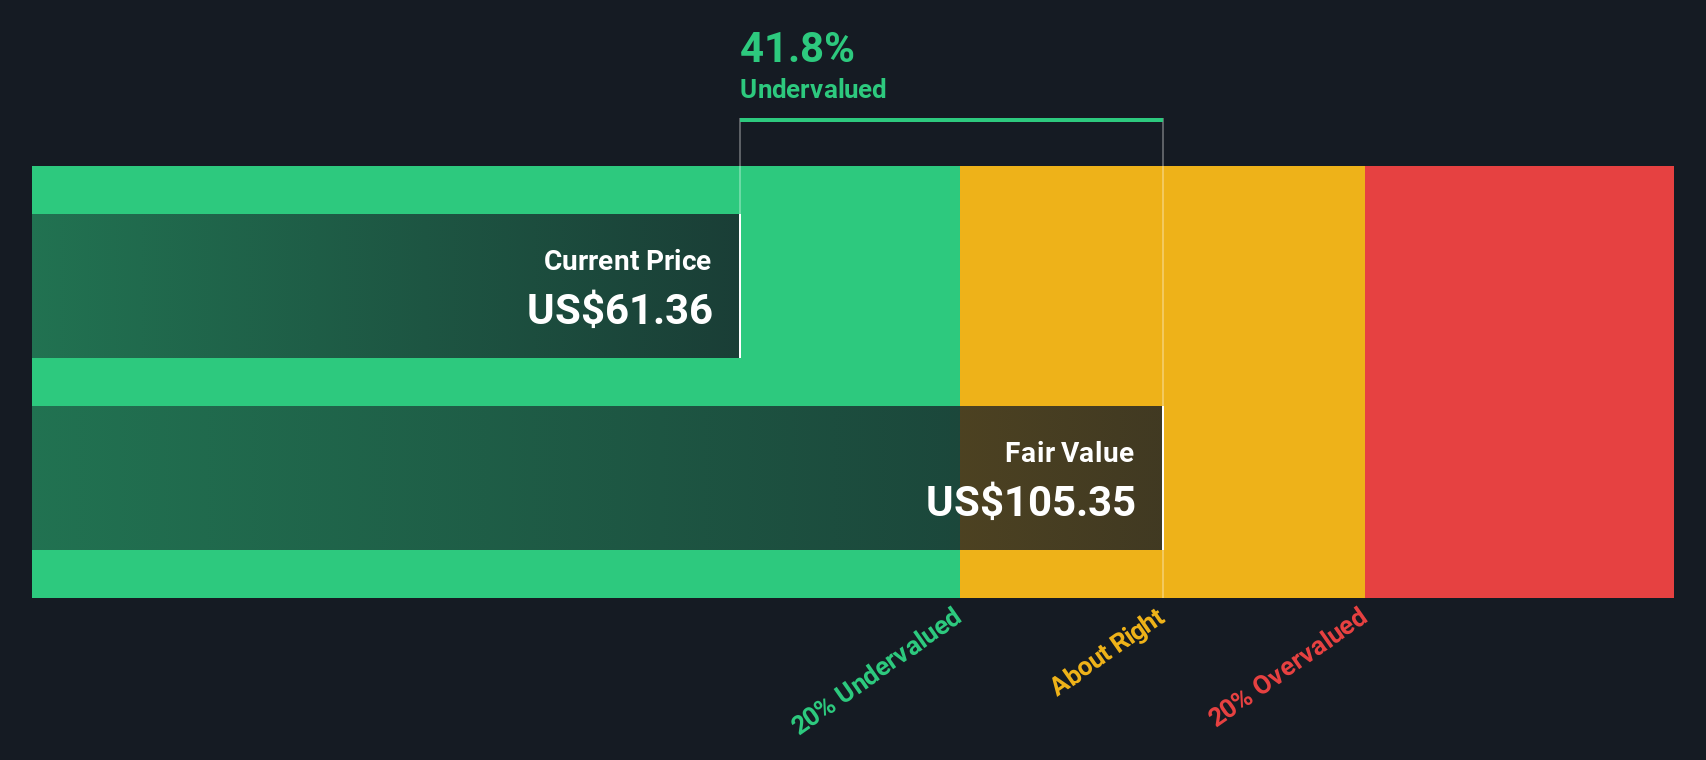
For a different perspective, consider our SWS DCF model. This method estimates General American Investors Company’s fair value at $106.33 per share, which is much higher than the recent market price of $58.74. According to the DCF, the stock appears significantly undervalued based on cash flow analysis.
Look into how the SWS DCF model arrives at its fair value.
This sharp difference between earnings-based and DCF valuation raises an important question: could the market be overlooking future cash flow potential, or are there risks not reflected in the projections?
Simply Wall St performs a discounted cash flow (DCF) on every stock in the world every day (check out General American Investors Company for example). We show the entire calculation in full. You can track the result in your watchlist or portfolio and be alerted when this changes, or use our stock screener to discover 914 undervalued stocks based on their cash flows. If you save a screener we even alert you when new companies match - so you never miss a potential opportunity.
Build Your Own General American Investors Company Narrative
If you have a different perspective or want to dig into the numbers yourself, you can craft your own view of General American Investors Company in just a few minutes. Do it your way
A great starting point for your General American Investors Company research is our analysis highlighting 1 key reward and 3 important warning signs that could impact your investment decision.
Looking for more investment ideas?
Unlock a world of fresh opportunities by using the Simply Wall Street Screener. Don’t watch promising trends pass you by while others get ahead.
- Accelerate your portfolio growth and check out these 914 undervalued stocks based on cash flows that analysts believe are currently trading below their true worth.
- Boost your passive income stream by researching these 15 dividend stocks with yields > 3% offering yields above 3%, providing options for long-term stability.
- Stay ahead of innovation’s curve and investigate these 30 healthcare AI stocks that are reshaping the medical landscape with AI-powered breakthroughs.
This article by Simply Wall St is general in nature. We provide commentary based on historical data and analyst forecasts only using an unbiased methodology and our articles are not intended to be financial advice. It does not constitute a recommendation to buy or sell any stock, and does not take account of your objectives, or your financial situation. We aim to bring you long-term focused analysis driven by fundamental data. Note that our analysis may not factor in the latest price-sensitive company announcements or qualitative material. Simply Wall St has no position in any stocks mentioned.
New: Manage All Your Stock Portfolios in One Place
We've created the ultimate portfolio companion for stock investors, and it's free.
• Connect an unlimited number of Portfolios and see your total in one currency
• Be alerted to new Warning Signs or Risks via email or mobile
• Track the Fair Value of your stocks
Have feedback on this article? Concerned about the content? Get in touch with us directly. Alternatively, email editorial-team@simplywallst.com
About NYSE:GAM
Good value with adequate balance sheet and pays a dividend.
Market Insights

Advertisement
Community Narratives
MicroVision will explode future revenue by 380.37% with a vision towards success
Fair Value US$60|98.4% undervalued
TH
Community Contributor
The Indispensable Artery for a New North American Economy
Fair Value CA$132.87|0.7% overvalued
TI
Community Contributor
Recently Updated Narratives
CE

cementafriend on Constellation Energy ·
Constellation Energy Dividends and Growth
Fair Value:US$348.054.7% overvalued
2 followersusers have followed this narrative
0 commentsusers have commented on this narrative
0 likesusers have liked this narrative
KH

Khagani on CoreWeave ·
CoreWeave's Revenue Expected to Rocket 77.88% in 5-Year Forecast
Fair Value:US$11033.5% undervalued
1 followerusers have followed this narrative
0 commentsusers have commented on this narrative
0 likesusers have liked this narrative
PO

PortfolioPlus on Bisalloy Steel Group ·
Bisalloy Steel Group will shine with a projected profit margin increase of 12.8%
Fair Value:AU$6.7118.0% undervalued
2 followersusers have followed this narrative
0 commentsusers have commented on this narrative
0 likesusers have liked this narrative
Popular Narratives
TH

TheWallstreetKing on MicroVision ·
MicroVision will explode future revenue by 380.37% with a vision towards success
Fair Value:US$6098.4% undervalued
103 followersusers have followed this narrative
10 commentsusers have commented on this narrative
20 likesusers have liked this narrative
AN


AnalystConsensusTarget on NVIDIA ·
NVDA: Expanding AI Demand Will Drive Major Data Center Investments Through 2026
Fair Value:US$250.3929.3% undervalued
936 followersusers have followed this narrative
6 commentsusers have commented on this narrative
23 likesusers have liked this narrative
OS


oscargarcia on Alphabet ·
The company that turned a verb into a global necessity and basically runs the modern internet, digital ads, smartphones, maps, and AI.
Fair Value:US$3405.8% undervalued
141 followersusers have followed this narrative
6 commentsusers have commented on this narrative
18 likesusers have liked this narrative