
Advertisement
- United States
- /
- Capital Markets
- /
- NYSE:DBRG
What You Can Learn From DigitalBridge Group, Inc.'s (NYSE:DBRG) P/S After Its 28% Share Price Crash
DigitalBridge Group, Inc. (NYSE:DBRG) shareholders won't be pleased to see that the share price has had a very rough month, dropping 28% and undoing the prior period's positive performance. The drop over the last 30 days has capped off a tough year for shareholders, with the share price down 22% in that time.
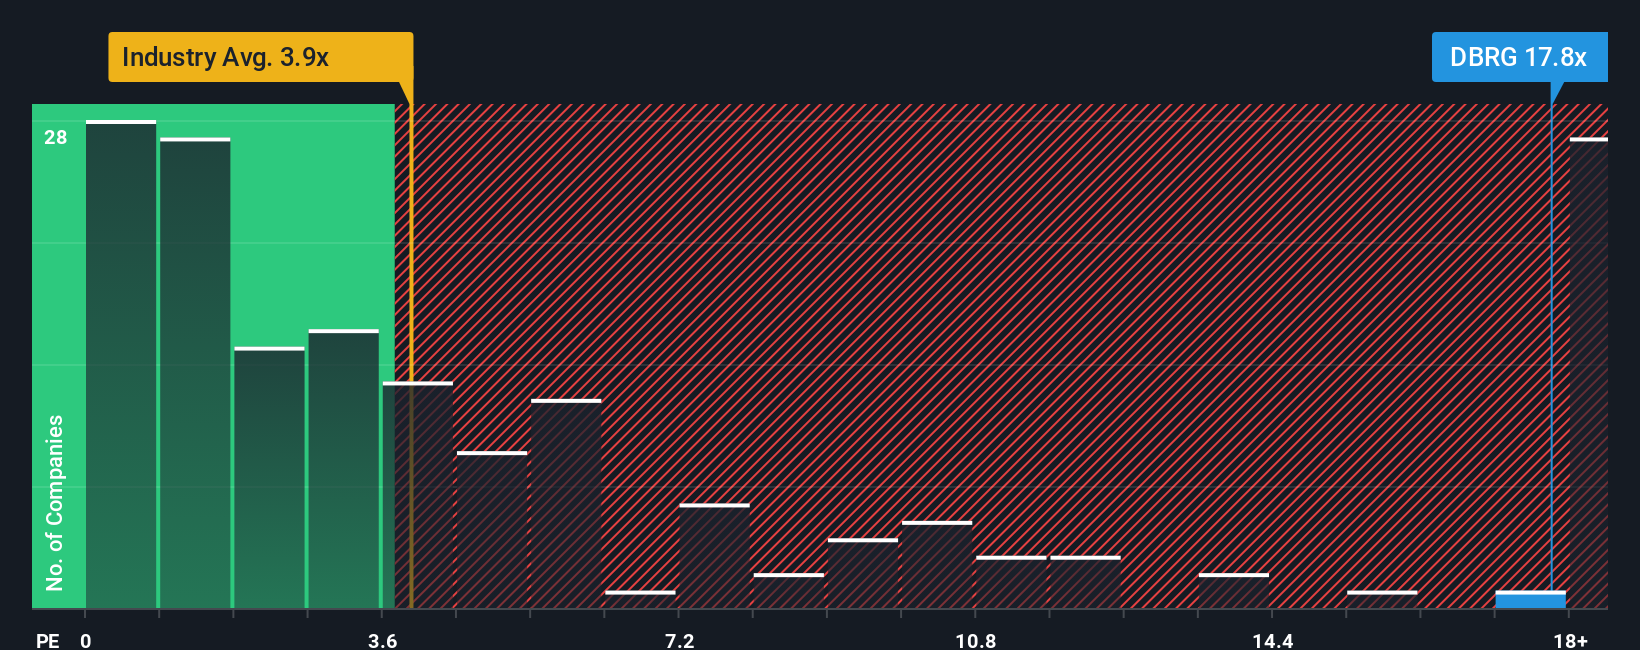
In spite of the heavy fall in price, DigitalBridge Group may still be sending strong sell signals at present with a price-to-sales (or "P/S") ratio of 17.8x, when you consider almost half of the companies in the Capital Markets industry in the United States have P/S ratios under 3.9x and even P/S lower than 1.8x aren't out of the ordinary. Nonetheless, we'd need to dig a little deeper to determine if there is a rational basis for the highly elevated P/S.
Check out our latest analysis for DigitalBridge Group
What Does DigitalBridge Group's Recent Performance Look Like?
DigitalBridge Group hasn't been tracking well recently as its declining revenue compares poorly to other companies, which have seen some growth in their revenues on average. It might be that many expect the dour revenue performance to recover substantially, which has kept the P/S from collapsing. However, if this isn't the case, investors might get caught out paying too much for the stock.
Keen to find out how analysts think DigitalBridge Group's future stacks up against the industry? In that case, our free report is a great place to start.What Are Revenue Growth Metrics Telling Us About The High P/S?
DigitalBridge Group's P/S ratio would be typical for a company that's expected to deliver very strong growth, and importantly, perform much better than the industry.
Retrospectively, the last year delivered a frustrating 89% decrease to the company's top line. The last three years don't look nice either as the company has shrunk revenue by 92% in aggregate. Therefore, it's fair to say the revenue growth recently has been undesirable for the company.
Looking ahead now, revenue is anticipated to climb by 73% per annum during the coming three years according to the seven analysts following the company. Meanwhile, the rest of the industry is forecast to only expand by 7.9% per annum, which is noticeably less attractive.
In light of this, it's understandable that DigitalBridge Group's P/S sits above the majority of other companies. Apparently shareholders aren't keen to offload something that is potentially eyeing a more prosperous future.
The Bottom Line On DigitalBridge Group's P/S
Even after such a strong price drop, DigitalBridge Group's P/S still exceeds the industry median significantly. Using the price-to-sales ratio alone to determine if you should sell your stock isn't sensible, however it can be a practical guide to the company's future prospects.
We've established that DigitalBridge Group maintains its high P/S on the strength of its forecasted revenue growth being higher than the the rest of the Capital Markets industry, as expected. At this stage investors feel the potential for a deterioration in revenues is quite remote, justifying the elevated P/S ratio. Unless the analysts have really missed the mark, these strong revenue forecasts should keep the share price buoyant.
Plus, you should also learn about this 1 warning sign we've spotted with DigitalBridge Group.
If you're unsure about the strength of DigitalBridge Group's business, why not explore our interactive list of stocks with solid business fundamentals for some other companies you may have missed.
New: Manage All Your Stock Portfolios in One Place
We've created the ultimate portfolio companion for stock investors, and it's free.
• Connect an unlimited number of Portfolios and see your total in one currency
• Be alerted to new Warning Signs or Risks via email or mobile
• Track the Fair Value of your stocks
Have feedback on this article? Concerned about the content? Get in touch with us directly. Alternatively, email editorial-team (at) simplywallst.com.
This article by Simply Wall St is general in nature. We provide commentary based on historical data and analyst forecasts only using an unbiased methodology and our articles are not intended to be financial advice. It does not constitute a recommendation to buy or sell any stock, and does not take account of your objectives, or your financial situation. We aim to bring you long-term focused analysis driven by fundamental data. Note that our analysis may not factor in the latest price-sensitive company announcements or qualitative material. Simply Wall St has no position in any stocks mentioned.
About NYSE:DBRG
DigitalBridge Group
DigitalBridge (NYSE: DBRG) is a leading global alternative asset manager dedicated to investing in digital infrastructure.
High growth potential with adequate balance sheet.
Similar Companies
Market Insights

Advertisement
Community Narratives
MINISO's fair value is projected at 26.69 with an anticipated PE ratio shift of 20x
Fair Value US$24.03|11.4% undervalued
BE
Community Contributor
Procter & Gamble: A Dividend Giant Facing Slowing Growth
Fair Value US$119.81|23.5% overvalued
AN
Community Contributor
Eli Lilly's Future Growth Driven by Tirzepatide and Favorable Market Conditions
Fair Value US$1.19k|14.0% undervalued
EA
Community Contributor