Advertisement
- United States
- /
- Diversified Financial
- /
- NYSE:BRK.A
Is Berkshire Hathaway Fairly Priced After Warren Buffett’s Latest Investment Strategy Shift?

Simply Wall St
Reviewed by Bailey Pemberton
- Ever wondered whether Berkshire Hathaway is actually a good deal at today's lofty price, or if you're just chasing the name? Let's cut through the noise and talk real value.
- The stock has climbed 1.3% in the past week, 2.4% over the last 30 days, and boasts a steady 11.9% year-to-date return. This shows both momentum and resilience that catch investors' attention.
- Recently, headlines have zeroed in on Warren Buffett's ongoing strategy shifts and new investment disclosures, raising fresh speculation about how the company's war chest will be deployed next. These developments give context to the recent share price moves and signal that the market is closely watching management's every move.
- Right now, Berkshire Hathaway lands a 4 out of 6 valuation score. This means it appears undervalued in most, but not all, of our key checks. We'll break down what this actually means for investors with a look at each approach to valuation, and hint at an even smarter way to measure value by the end.
Approach 1: Berkshire Hathaway Excess Returns Analysis
The Excess Returns model offers investors a direct way to assess value by comparing the company’s actual return on equity against its cost of equity. In Berkshire Hathaway’s case, this approach examines how much profit the company can generate from its book value above and beyond what typical capital providers would expect. The focus is on both sustainable profitability and the growth in book value over time to estimate long-run intrinsic worth.
Berkshire Hathaway’s average return on equity over the past five years stands at a robust 12.85%, comfortably exceeding its cost of equity of $38,769.91 per share. Using stable book value projections of $514,986.06 per share and steady earnings per share of $66,154.88, the estimated annual excess return comes to $27,384.97 per share. This demonstrates a consistent ability to generate value beyond the baseline required by investors, rooted in the company’s high-quality asset base and disciplined management approach.
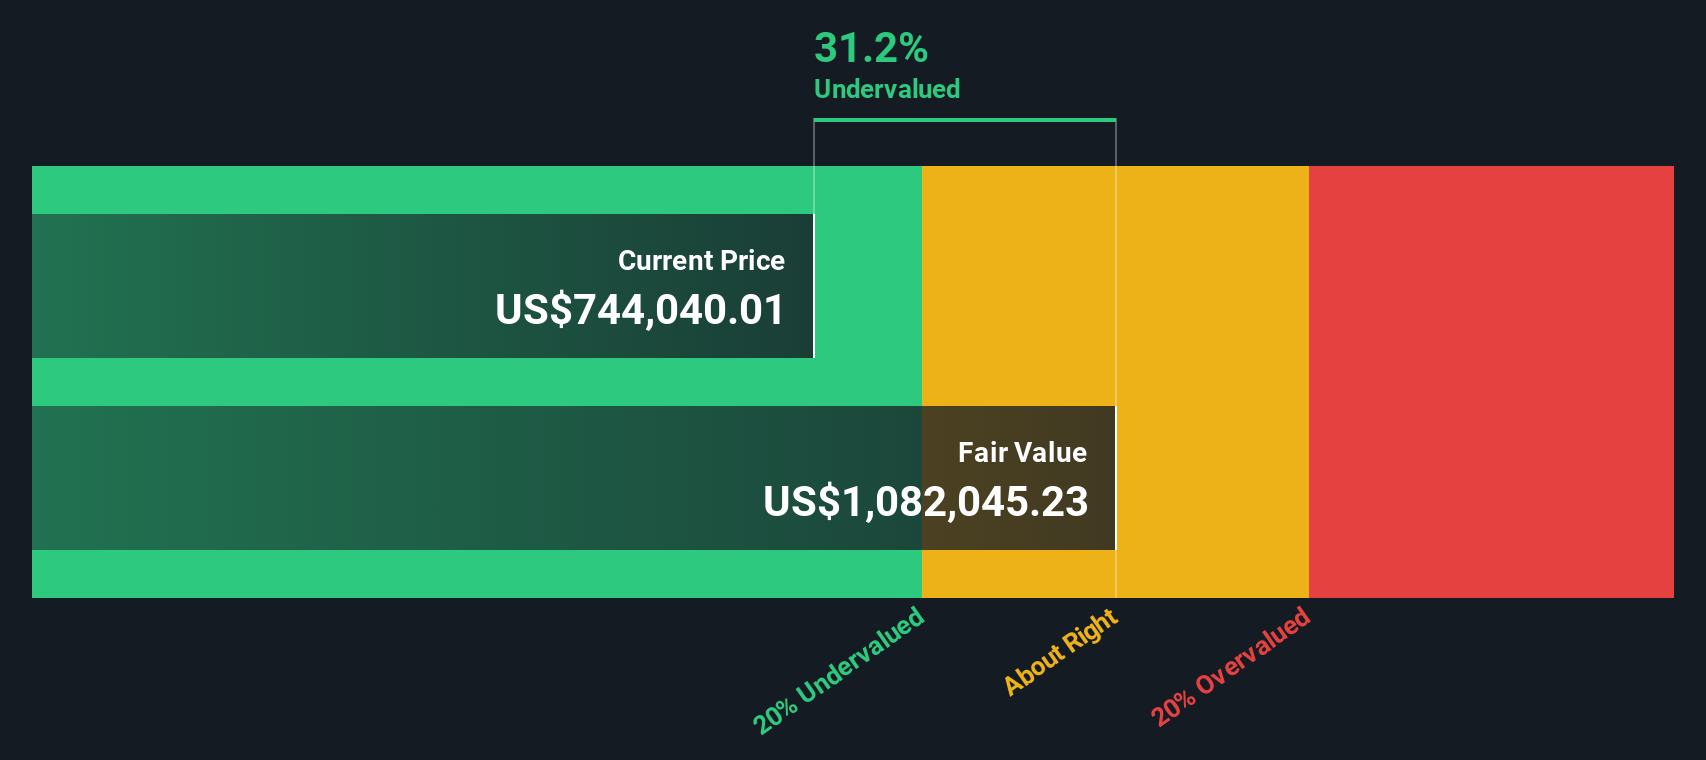
The Excess Returns analysis calculates Berkshire Hathaway’s intrinsic value at $1,156,569.39 per share. When set against the current market price, this implies the stock is trading at a 34.7% discount, suggesting meaningful undervaluation by this measure.
Result: UNDERVALUED
Our Excess Returns analysis suggests Berkshire Hathaway is undervalued by 34.7%. Track this in your watchlist or portfolio, or discover 906 more undervalued stocks based on cash flows.
Approach 2: Berkshire Hathaway Price vs Earnings
For mature, profitable companies like Berkshire Hathaway, the Price-to-Earnings (PE) ratio is a widely used and effective valuation metric. It tells investors how much they are paying for each dollar of current earnings, making it particularly useful when steady profits are the norm and future growth is expected to be manageable rather than explosive.
Growth expectations and perceived risk both play key roles in determining what a "normal" or "fair" PE ratio should be. Companies with reliable, faster earnings growth or lower risk profiles generally command higher PE multiples. Conversely, if growth is expected to lag the market or company-specific risks are elevated, a lower PE might be warranted.
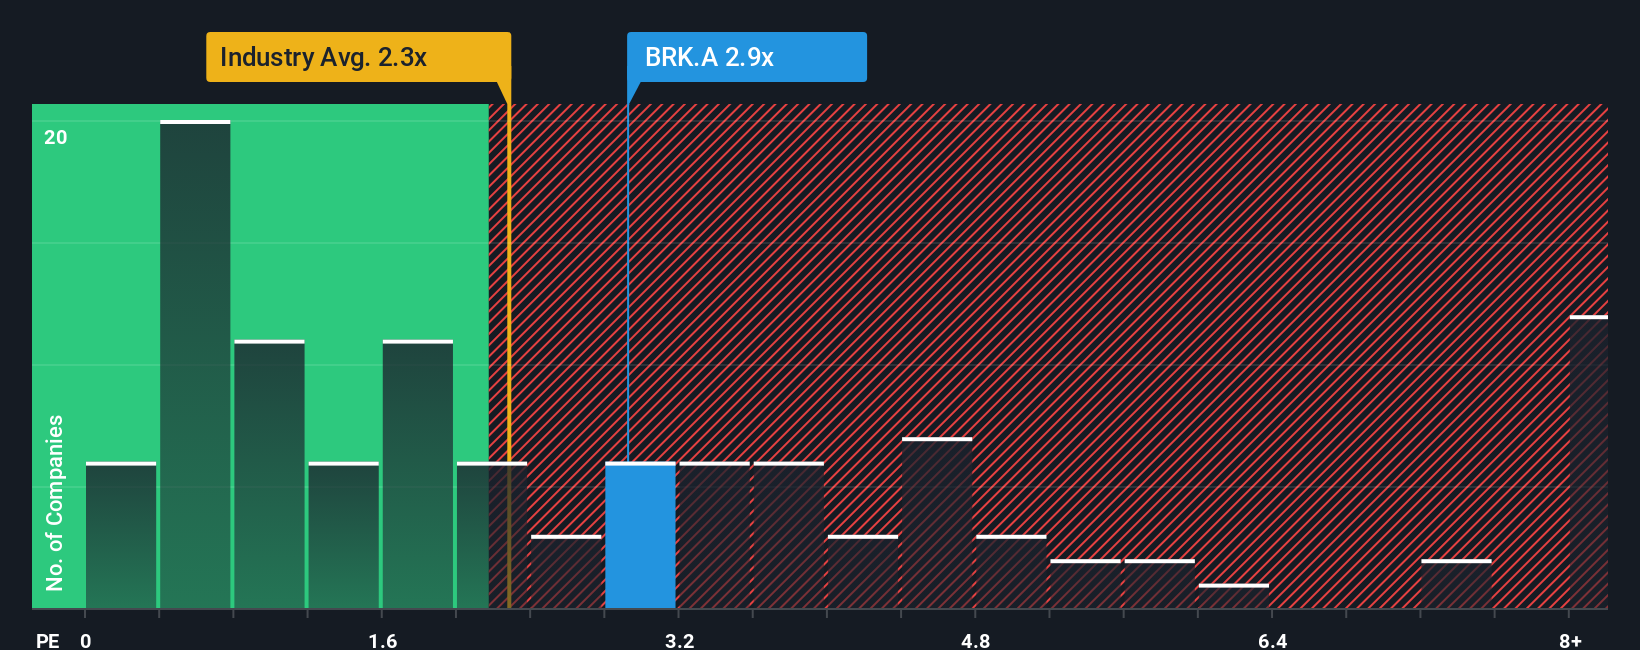
Berkshire Hathaway currently trades at 16.1x earnings. That puts it above the Diversified Financial industry average of 13.0x, but well below the peer group average of 24.0x. To add more context, Simply Wall St’s proprietary "Fair Ratio" for Berkshire Hathaway is 17.0x. This is an estimate of the multiple Berkshire “should” trade at, factoring in earnings growth, profit margins, size, and company-specific risks. This approach is more comprehensive than simply comparing to peers or industry averages.
Since Berkshire's current PE ratio of 16.1x sits just below the Fair Ratio of 17.0x, the stock appears to be trading about where it should be based on its individual characteristics and risk profile.
Result: ABOUT RIGHT
PE ratios tell one story, but what if the real opportunity lies elsewhere? Discover 1421 companies where insiders are betting big on explosive growth.
Upgrade Your Decision Making: Choose your Berkshire Hathaway Narrative
Earlier we mentioned that there is an even better way to understand valuation, so let's introduce you to Narratives. Narratives are easy-to-build, personal stories investors create on Simply Wall St's Community page to connect their view of a company's future with their fair value estimate. This process links what they believe will happen to the business, the financial forecast, and ultimately what the stock should be worth.
Rather than just using static ratios or models, Narratives empower you to blend your outlook on Berkshire Hathaway’s business with assumptions about future revenue, profitability, or management changes. This results in a fair value that updates dynamically as new news, earnings, or events emerge. You can quickly see whether the current market price aligns with your story, giving you extra confidence when deciding whether to buy, hold, or sell.
For example, some investors currently peg Berkshire’s fair value as high as $606,000 per share, convinced that its cash-rich position and disciplined management will win out over time. Others, with a more cautious take on growth or succession risk, set their fair value closer to $403,000 per share. With Narratives, you can easily adjust your assumptions, see their impact, and make smarter, story-backed investment decisions in real time.
Do you think there's more to the story for Berkshire Hathaway? Head over to our Community to see what others are saying!
This article by Simply Wall St is general in nature. We provide commentary based on historical data and analyst forecasts only using an unbiased methodology and our articles are not intended to be financial advice. It does not constitute a recommendation to buy or sell any stock, and does not take account of your objectives, or your financial situation. We aim to bring you long-term focused analysis driven by fundamental data. Note that our analysis may not factor in the latest price-sensitive company announcements or qualitative material. Simply Wall St has no position in any stocks mentioned.
Valuation is complex, but we're here to simplify it.
Discover if Berkshire Hathaway might be undervalued or overvalued with our detailed analysis, featuring fair value estimates, potential risks, dividends, insider trades, and its financial condition.
Access Free AnalysisHave feedback on this article? Concerned about the content? Get in touch with us directly. Alternatively, email editorial-team@simplywallst.com
About NYSE:BRK.A
Berkshire Hathaway
Through its subsidiaries, engages in the insurance, freight rail transportation, and utility businesses.
Flawless balance sheet and good value.
Similar Companies
Market Insights

Advertisement
Community Narratives
MicroVision will explode future revenue by 380.37% with a vision towards success
Fair Value US$60.00|98.5% undervalued
TH
Community Contributor
The Indispensable Artery for a New North American Economy
Fair Value CA$132.87|2.3% undervalued
TI
Community Contributor