Advertisement
- United States
- /
- Diversified Financial
- /
- NYSE:BRK.A
Berkshire Hathaway (BRK.A): Examining Valuation After Steady 12-Month Gains and Long-Term Returns

Simply Wall St
Reviewed by Simply Wall St
Berkshire Hathaway (BRK.A) has continued to capture investor interest recently, thanks to its sizable returns over the past year and steady performance during shifting market conditions. With the stock up 6% over twelve months, some investors are revisiting its long-term track record and fundamentals.
See our latest analysis for Berkshire Hathaway.
Berkshire Hathaway’s steady momentum continues, with recent share price returns reflecting the market’s confidence in its resilient business model. The stock’s year-to-date share price gain of nearly 12% adds to its strong 1-year total shareholder return of 5.8%. Its impressive 3-year total return of 57.8% suggests the long-term story remains intact, even as near-term price shifts draw scrutiny from watchful investors.
If you’re keen to explore what else is powering growth behind the scenes, this could be your moment to discover fast growing stocks with high insider ownership
With shares trading close to analyst price targets, but long-term returns still strong, the question for investors now is whether Berkshire Hathaway is trading at a bargain or if the market has already accounted for its future growth prospects.
Price-to-Earnings of 16.1x: Is it justified?
Berkshire Hathaway currently trades at a price-to-earnings (P/E) ratio of 16.1x, which places its valuation above the average for the US Diversified Financial industry. With a last close of $755,320 per share, investors are paying a premium compared to similar businesses.
The price-to-earnings multiple measures how much investors are willing to pay for each dollar of the company’s profit. For well-established, diversified financial businesses, the P/E ratio is a crucial indicator of market confidence in future earnings and competitive positioning.
Berkshire’s P/E of 16.1x is noticeably higher than the industry average of 13.2x. This suggests the market prices in steady earnings and a strong franchise. However, it also means new investors are paying more for the same level of profits. Compared to an estimated fair price-to-earnings ratio of 17x, Berkshire appears slightly conservatively priced on this metric and might have room to rerate upwards if confidence continues to improve.
Explore the SWS fair ratio for Berkshire Hathaway
Result: Price-to-Earnings of 16.1x (ABOUT RIGHT)
However, slowing net income growth and shares trading close to analyst targets could challenge the case for further outperformance, warranting careful attention from investors.
Find out about the key risks to this Berkshire Hathaway narrative.
Another View: Discounted Cash Flow Perspective
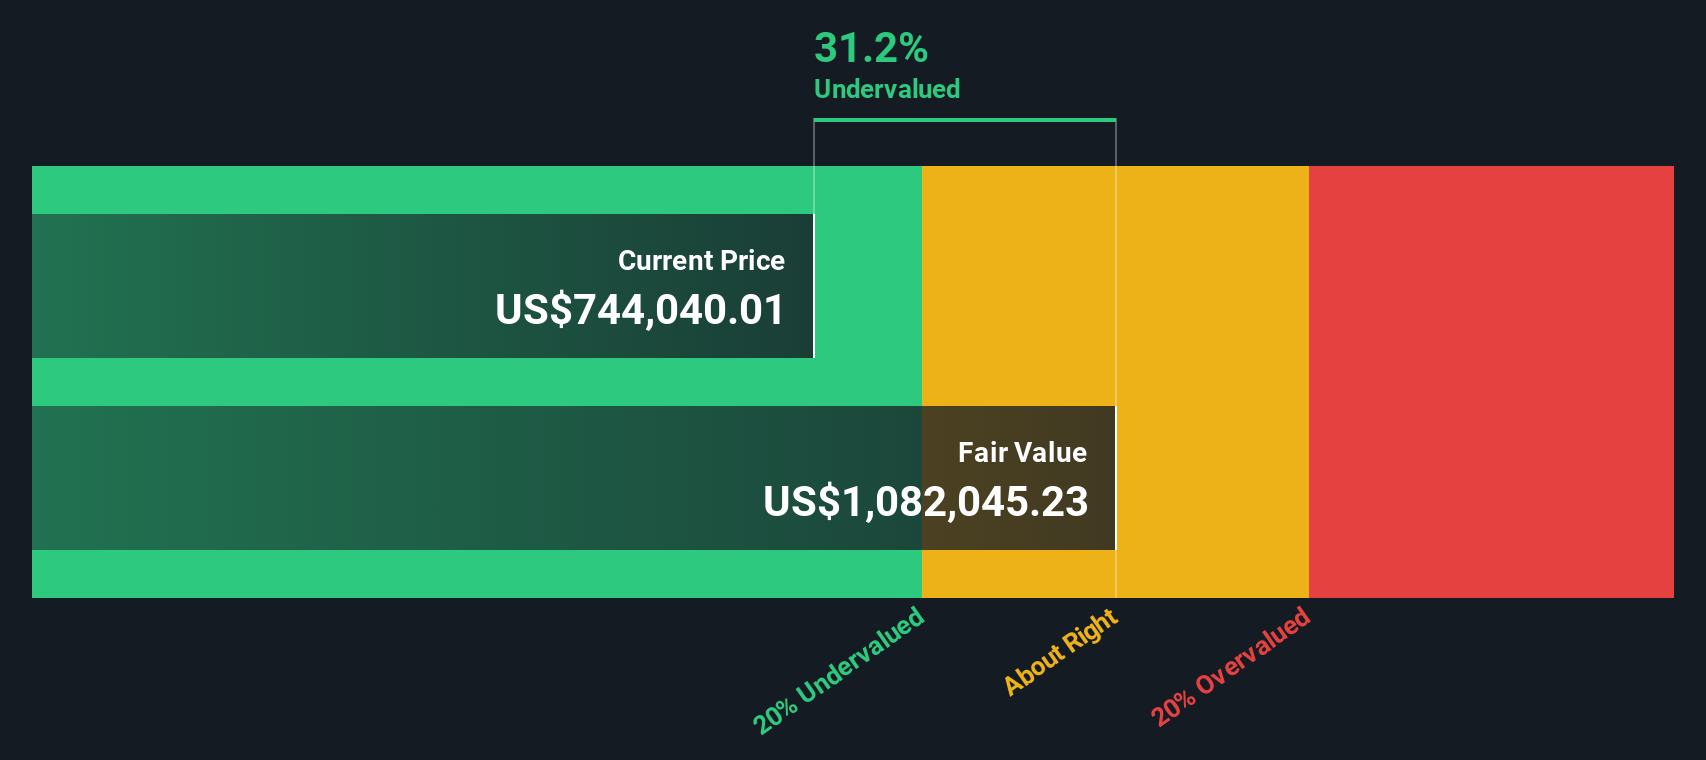
While the price-to-earnings ratio offers one perspective, the SWS DCF model provides a different outlook. According to our fair value estimate, Berkshire Hathaway's shares are trading over 34% below this level, which suggests the company could be materially undervalued. Could the market be overlooking Berkshire’s intrinsic worth, or is there more risk here than meets the eye?
Look into how the SWS DCF model arrives at its fair value.
Simply Wall St performs a discounted cash flow (DCF) on every stock in the world every day (check out Berkshire Hathaway for example). We show the entire calculation in full. You can track the result in your watchlist or portfolio and be alerted when this changes, or use our stock screener to discover 928 undervalued stocks based on their cash flows. If you save a screener we even alert you when new companies match - so you never miss a potential opportunity.
Build Your Own Berkshire Hathaway Narrative
If you have your own perspective or want to see the numbers for yourself, you can piece together your own Berkshire Hathaway story in just a few minutes. Do it your way
A great starting point for your Berkshire Hathaway research is our analysis highlighting 1 key reward and 2 important warning signs that could impact your investment decision.
Looking for More Smart Investment Opportunities?
Don’t settle for just one idea when you could be gathering an edge across exciting sectors, growing themes, and long-term winners that others might miss.
- Uncover strong income plays and tap into potential for consistent returns with these 16 dividend stocks with yields > 3% yielding over 3%.
- Spot market disruptors and fuel your portfolio’s growth by checking out these 26 AI penny stocks transforming industries with advanced artificial intelligence.
- Catch undervalued gems before the crowd by sifting through these 928 undervalued stocks based on cash flows based on robust cash flow analysis.
This article by Simply Wall St is general in nature. We provide commentary based on historical data and analyst forecasts only using an unbiased methodology and our articles are not intended to be financial advice. It does not constitute a recommendation to buy or sell any stock, and does not take account of your objectives, or your financial situation. We aim to bring you long-term focused analysis driven by fundamental data. Note that our analysis may not factor in the latest price-sensitive company announcements or qualitative material. Simply Wall St has no position in any stocks mentioned.
Valuation is complex, but we're here to simplify it.
Discover if Berkshire Hathaway might be undervalued or overvalued with our detailed analysis, featuring fair value estimates, potential risks, dividends, insider trades, and its financial condition.
Access Free AnalysisHave feedback on this article? Concerned about the content? Get in touch with us directly. Alternatively, email editorial-team@simplywallst.com
About NYSE:BRK.A
Berkshire Hathaway
Through its subsidiaries, engages in the insurance, freight rail transportation, and utility businesses.
Flawless balance sheet and good value.
Similar Companies
Market Insights

Advertisement
Community Narratives
MicroVision will explode future revenue by 380.37% with a vision towards success
Fair Value US$60.00|98.4% undervalued
TH
Community Contributor
The Indispensable Artery for a New North American Economy
Fair Value CA$132.87|1.3% undervalued
TI
Community Contributor