Advertisement
- United States
- /
- Consumer Finance
- /
- NYSE:AXP
Should You Rethink Your View on Amex After Its 29.5% Price Jump?

Simply Wall St
Reviewed by Bailey Pemberton
- Thinking about whether American Express is a good value right now? You are not alone, as many investors are weighing its price tag against its growth story.
- The stock has been anything but sleepy, climbing 2.2% over the last week, 13.8% in the last month, and delivering an impressive 29.5% return over the past year.
- Much of this momentum reflects shifting market sentiment after several high-profile analyst upgrades and ongoing consumer strength in the payments sector. Recent news highlights American Express’s strategic partnerships and product rollouts. This suggests the company is innovating to capture more of the premium card market.
- However, based on our valuation checks, American Express scores just 1 out of 6 for being undervalued. Investors need to look closely at how the numbers add up. We will break down the standard valuation methods in a moment and share a smarter way to think about value at the end.
American Express scores just 1/6 on our valuation checks. See what other red flags we found in the full valuation breakdown.
Approach 1: American Express Excess Returns Analysis
The Excess Returns model evaluates a company's ability to generate returns on its invested capital beyond the required cost of equity. In simple terms, it measures how much profit American Express can consistently earn in excess of what is needed to satisfy investors for the risk they take.
For American Express, this model reflects strong fundamentals. The company’s Book Value is $47.05 per share while its Stable Earnings Per Share are estimated at $18.30, based on the weighted future Return on Equity projections from 13 analysts. The current Cost of Equity is $4.21 per share, which means that each year, American Express is generating an Excess Return of $14.09 per share. The average Return on Equity stands at an impressive 36.37%. Looking ahead, the Stable Book Value is projected at $50.30 per share, as estimated by analysts.
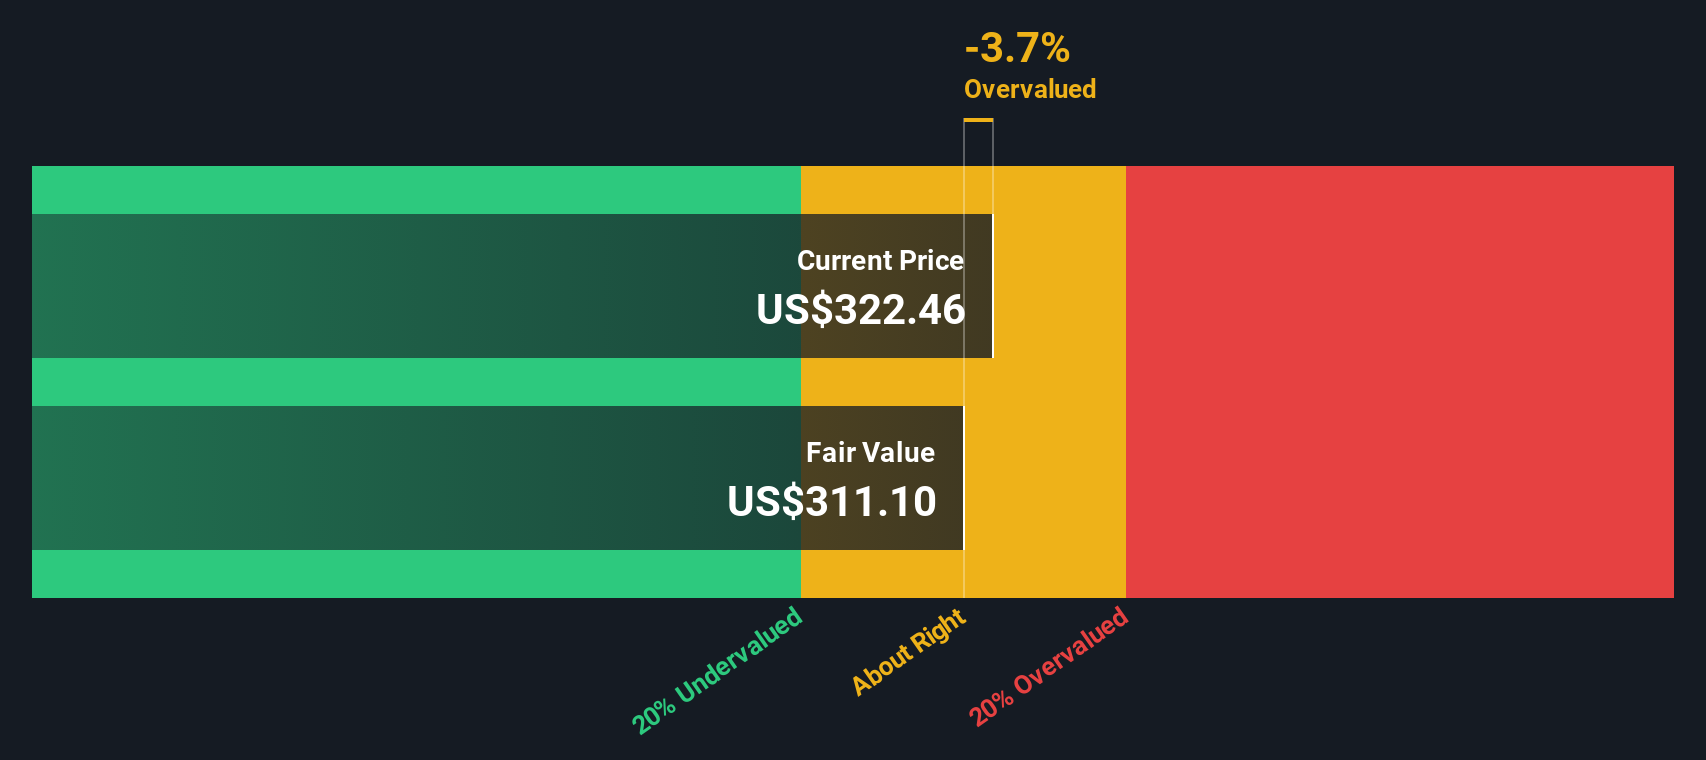
Given these inputs, the Excess Returns model places the intrinsic value of American Express stock at $326.31 per share. Comparing this to the market price reveals the stock is trading at a 12.9% premium to its intrinsic value, suggesting it is overvalued based on this approach.
Result: OVERVALUED
Our Excess Returns analysis suggests American Express may be overvalued by 12.9%. Discover 870 undervalued stocks or create your own screener to find better value opportunities.
Approach 2: American Express Price vs Earnings
The Price-to-Earnings (PE) ratio is a widely respected way to value profitable companies like American Express because it ties the company’s share price directly to its actual earnings power. For companies consistently generating healthy profits, PE helps investors see what they are paying for each dollar of earnings, which is vital for judging real value.
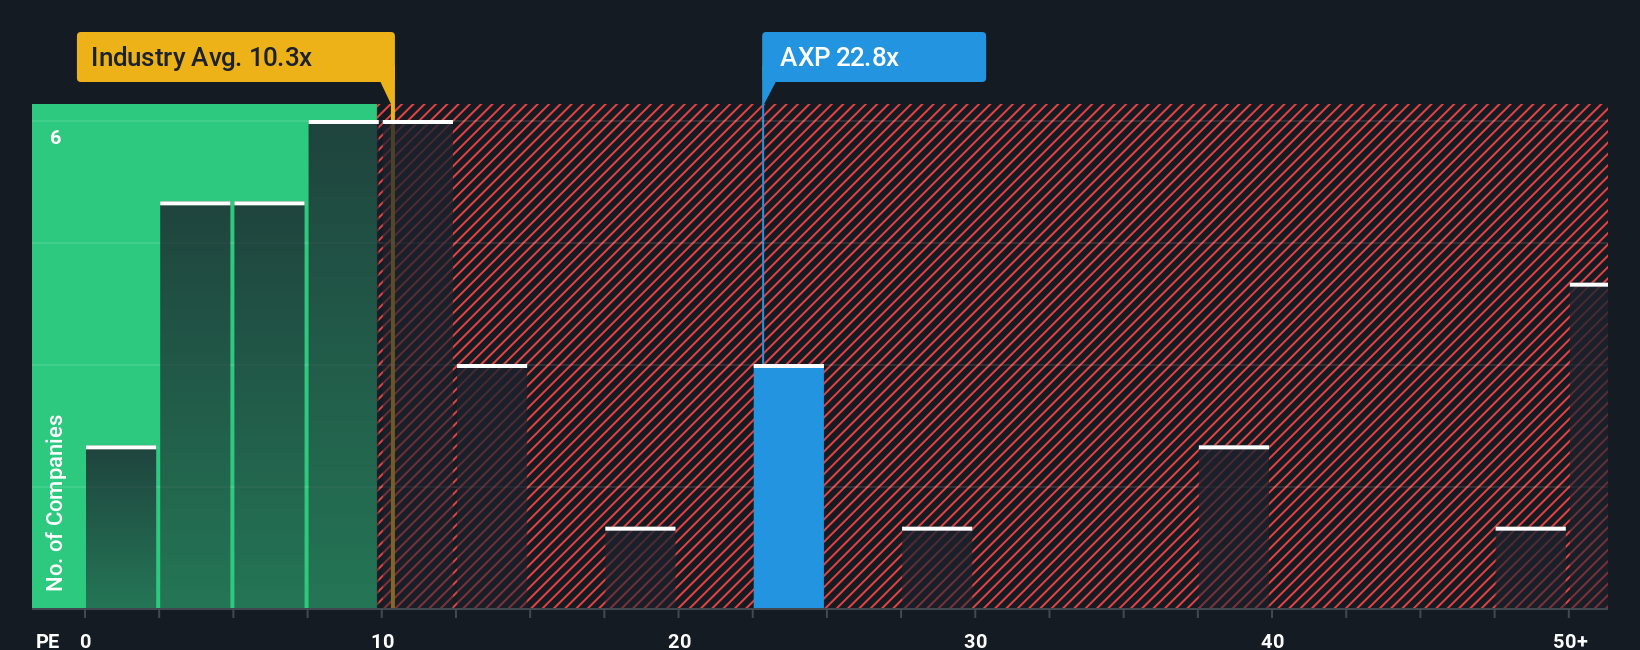
Growth expectations and perceived risk play a big role in determining what the “right” PE should be. Companies with stronger growth and lower risks tend to command higher PE multiples, while more mature or riskier firms usually trade at lower ratios. American Express currently trades at a PE of 24.4x, which is just below the average for similar peers at 25.2x and well above the Consumer Finance industry average of 10.4x. This suggests investors are willing to pay a premium, perhaps due to American Express's brand strength and profit track record.
However, instead of only benchmarking against industry or peer averages, Simply Wall St’s proprietary “Fair Ratio” considers American Express’s unique mix of earnings growth, margin, risk profile, industry, and size to suggest what a fair PE multiple should be. In this case, the Fair Ratio for American Express is 19.8x. Because this ratio is tailored to the company’s fundamentals and outlook, it offers a more refined yardstick than basic comparisons.
Since the company’s current PE of 24.4x is noticeably above its Fair Ratio of 19.8x, this approach points to American Express being somewhat overvalued on a PE basis at this time.
Result: OVERVALUED
PE ratios tell one story, but what if the real opportunity lies elsewhere? Discover 1396 companies where insiders are betting big on explosive growth.
Upgrade Your Decision Making: Choose your American Express Narrative
Earlier we mentioned that there is an even better way to understand valuation. Let’s introduce you to Narratives. A Narrative is simply your story about a company: it connects your insights, forecasts and fair value estimates, such as future revenue, earnings, and margins, to a clear investment thesis backed by numbers. Narratives transform financial analysis from just crunching numbers into a more powerful decision-making process by tying a company’s changing business outlook to a real-time fair value.
On Simply Wall St’s Community page, anyone can build and share Narratives with just a few clicks. This is an easy, approachable step used by millions of investors to clarify what really matters. Narratives help you track whether you should hold, buy or sell by quickly highlighting the gap between your Fair Value estimate and the latest Price, and they are updated instantly as news or earnings reports roll in.
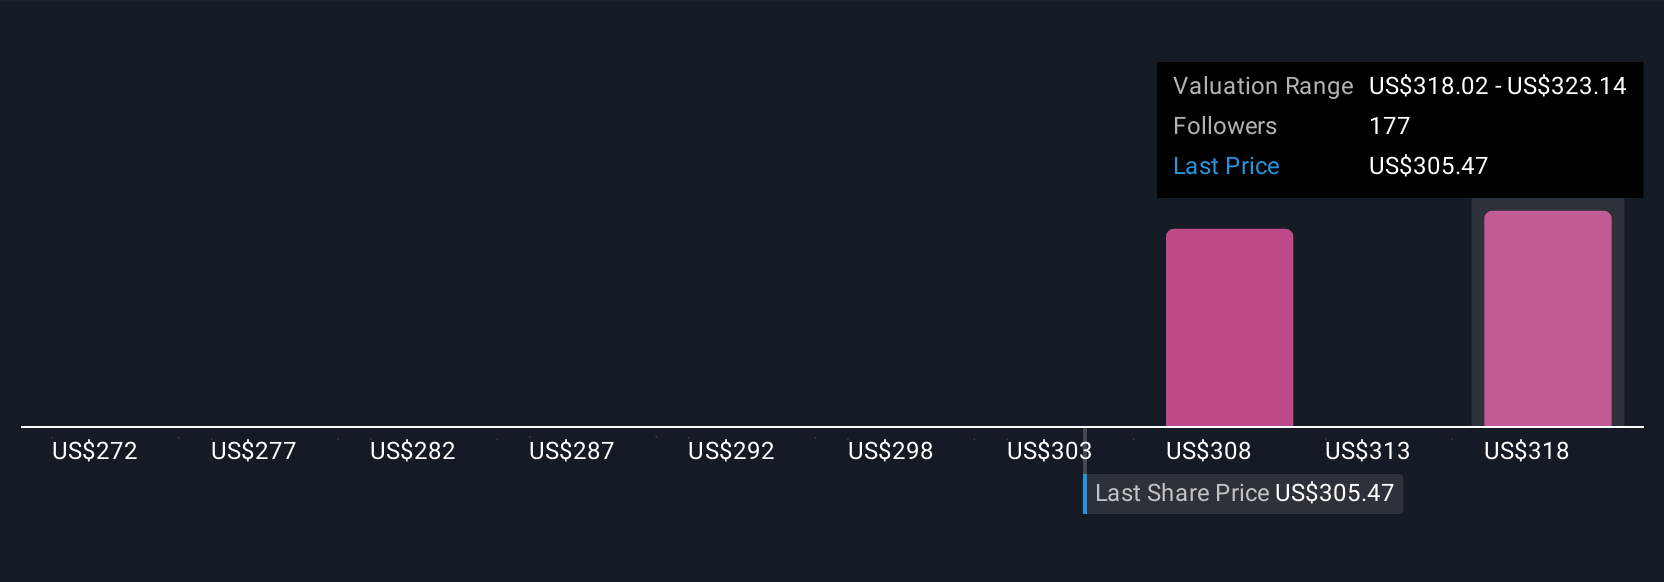
For American Express, one investor may believe its expansion into digital payments and booming international demand justify a Fair Value as high as $366.63. Meanwhile, a more cautious view focused on saturated US markets and spending risks could place Fair Value much lower, at $230.00.
Do you think there's more to the story for American Express? Head over to our Community to see what others are saying!
This article by Simply Wall St is general in nature. We provide commentary based on historical data and analyst forecasts only using an unbiased methodology and our articles are not intended to be financial advice. It does not constitute a recommendation to buy or sell any stock, and does not take account of your objectives, or your financial situation. We aim to bring you long-term focused analysis driven by fundamental data. Note that our analysis may not factor in the latest price-sensitive company announcements or qualitative material. Simply Wall St has no position in any stocks mentioned.
New: Manage All Your Stock Portfolios in One Place
We've created the ultimate portfolio companion for stock investors, and it's free.
• Connect an unlimited number of Portfolios and see your total in one currency
• Be alerted to new Warning Signs or Risks via email or mobile
• Track the Fair Value of your stocks
Have feedback on this article? Concerned about the content? Get in touch with us directly. Alternatively, email editorial-team@simplywallst.com
About NYSE:AXP
American Express
Operates as integrated payments company in the United States, Europe, the Middle East and Africa, the Asia Pacific, Australia, New Zealand, Latin America, Canada, the Caribbean, and Internationally.
Excellent balance sheet average dividend payer.
Similar Companies
Market Insights

Advertisement
Community Narratives
The company that turned a verb into a global necessity and basically runs the modern internet, digital ads, smartphones, maps, and AI.
Fair Value US$300.00|7.1% undervalued
OS
Community Contributor
Flowers Foods Pays A Fair Price For Health
Fair Value US$16.12|26.4% undervalued
NV
Community Contributor
TMX Group will thrive with 33.3% profit margin and enduring market moat
Fair Value CA$49.90|0.8% overvalued
LI
Community Contributor
The "Molecular Pencil": Why Beam's Technology is Built to Win
Fair Value US$65.01|65.8% undervalued
DA
Community Contributor