
Advertisement
- United States
- /
- Capital Markets
- /
- NYSE:APAM
The total return for Artisan Partners Asset Management (NYSE:APAM) investors has risen faster than earnings growth over the last five years

While Artisan Partners Asset Management Inc. (NYSE:APAM) shareholders are probably generally happy, the stock hasn't had particularly good run recently, with the share price falling 22% in the last quarter. But at least the stock is up over the last five years. In that time, it is up 42%, which isn't bad, but is below the market return of 91%.
Although Artisan Partners Asset Management has shed US$104m from its market cap this week, let's take a look at its longer term fundamental trends and see if they've driven returns.
Our free stock report includes 3 warning signs investors should be aware of before investing in Artisan Partners Asset Management. Read for free now.To quote Buffett, 'Ships will sail around the world but the Flat Earth Society will flourish. There will continue to be wide discrepancies between price and value in the marketplace...' One imperfect but simple way to consider how the market perception of a company has shifted is to compare the change in the earnings per share (EPS) with the share price movement.
During five years of share price growth, Artisan Partners Asset Management achieved compound earnings per share (EPS) growth of 5.1% per year. This EPS growth is lower than the 7% average annual increase in the share price. This suggests that market participants hold the company in higher regard, these days. That's not necessarily surprising considering the five-year track record of earnings growth.
You can see below how EPS has changed over time (discover the exact values by clicking on the image).
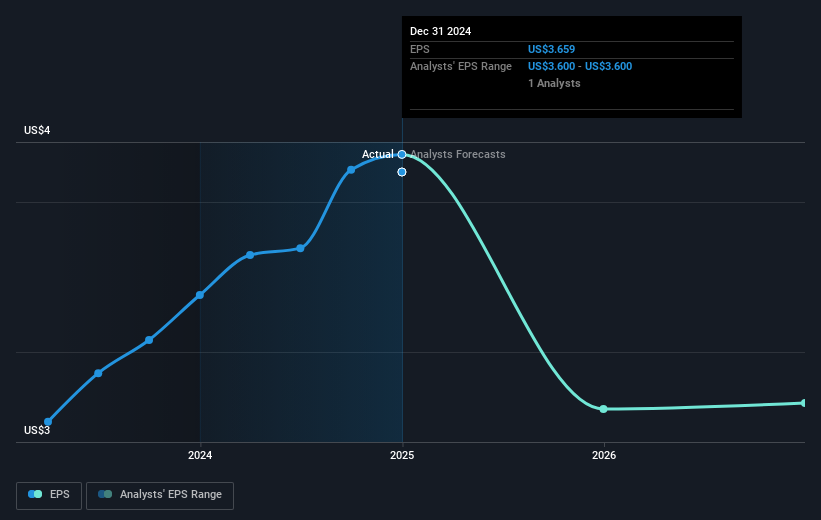
We know that Artisan Partners Asset Management has improved its bottom line lately, but is it going to grow revenue? You could check out this free report showing analyst revenue forecasts.
What About Dividends?
When looking at investment returns, it is important to consider the difference between total shareholder return (TSR) and share price return. Whereas the share price return only reflects the change in the share price, the TSR includes the value of dividends (assuming they were reinvested) and the benefit of any discounted capital raising or spin-off. Arguably, the TSR gives a more comprehensive picture of the return generated by a stock. In the case of Artisan Partners Asset Management, it has a TSR of 115% for the last 5 years. That exceeds its share price return that we previously mentioned. This is largely a result of its dividend payments!
A Different Perspective
Artisan Partners Asset Management shareholders are down 13% for the year (even including dividends), but the market itself is up 4.0%. Even the share prices of good stocks drop sometimes, but we want to see improvements in the fundamental metrics of a business, before getting too interested. On the bright side, long term shareholders have made money, with a gain of 17% per year over half a decade. If the fundamental data continues to indicate long term sustainable growth, the current sell-off could be an opportunity worth considering. It's always interesting to track share price performance over the longer term. But to understand Artisan Partners Asset Management better, we need to consider many other factors. Take risks, for example - Artisan Partners Asset Management has 3 warning signs (and 1 which is significant) we think you should know about.
For those who like to find winning investments this free list of undervalued companies with recent insider purchasing, could be just the ticket.
Please note, the market returns quoted in this article reflect the market weighted average returns of stocks that currently trade on American exchanges.
New: Manage All Your Stock Portfolios in One Place
We've created the ultimate portfolio companion for stock investors, and it's free.
• Connect an unlimited number of Portfolios and see your total in one currency
• Be alerted to new Warning Signs or Risks via email or mobile
• Track the Fair Value of your stocks
Have feedback on this article? Concerned about the content? Get in touch with us directly. Alternatively, email editorial-team (at) simplywallst.com.
This article by Simply Wall St is general in nature. We provide commentary based on historical data and analyst forecasts only using an unbiased methodology and our articles are not intended to be financial advice. It does not constitute a recommendation to buy or sell any stock, and does not take account of your objectives, or your financial situation. We aim to bring you long-term focused analysis driven by fundamental data. Note that our analysis may not factor in the latest price-sensitive company announcements or qualitative material. Simply Wall St has no position in any stocks mentioned.
About NYSE:APAM
Artisan Partners Asset Management
Artisan Partners Asset Management Inc. is publicly owned investment manager.
Solid track record with excellent balance sheet and pays a dividend.
Similar Companies
Market Insights

Advertisement
Community Narratives
Vita Life Sciences Set for a 12.72% Revenue Growth While Tackling Operational Challenges
Fair Value AU$2.42|12.0% undervalued
RO
Community Contributor
Vossloh rides a €500 billion wave to boost growth and earnings in the next decade
Fair Value €78.41|5.2% undervalued
CH
Community Contributor
Intuitive Surgical Will Transform Healthcare with 12% Revenue Growth
Fair Value US$325.55|57.3% overvalued
UN
Community Contributor