Advertisement
- United States
- /
- Capital Markets
- /
- NasdaqGS:STEP
StepStone Group (STEP): Evaluating Valuation as Riyadh Expansion Highlights Global Growth Ambitions

Simply Wall St
Reviewed by Simply Wall St
StepStone Group (STEP) just announced a major move by opening its first office in Riyadh. This new presence in Saudi Arabia is directly connected to the Kingdom’s Vision 2030 strategy and sets the stage for deeper partnerships in the region.
See our latest analysis for StepStone Group.
StepStone’s latest expansion into Riyadh follows its recent role as a lead investor in the high-profile recapitalization of critical infrastructure firm XKIG. While these moves grabbed headlines, what is really catching attention is the 9.98% year-to-date share price return and a remarkable 139% total shareholder return over three years. This suggests that investor optimism around growth and leadership in alternative investments is continuing to build.
If you're exploring what else is gaining momentum beyond the headlines, consider branching out and discovering fast growing stocks with high insider ownership.
But with shares rallying over the past three years and trading just below analyst targets, the big question is whether StepStone is still undervalued or if the market has already factored in its next phase of growth.
Price-to-Sales of 3.7x: Is it justified?
StepStone Group’s stock trades at a price-to-sales (P/S) ratio of 3.7x, suggesting the market is valuing each dollar of StepStone’s sales just below the industry average, and far below its closest peers.
The price-to-sales multiple is an essential metric for evaluating companies in financial sectors, particularly when earnings can be volatile or negative. For StepStone, this ratio reflects how much investors are willing to pay for its current level of revenue, even as profits remain elusive.
Compared to the US Capital Markets industry, where the average P/S sits at 3.9x, StepStone looks attractively priced. The spread is even wider compared to its peer group, which averages a much higher 6.1x. However, the estimated fair P/S ratio for StepStone is just 1.6x, so the current valuation could face pressure if investors begin demanding more in line with those fair value benchmarks.
Explore the SWS fair ratio for StepStone Group
Result: Price-to-Sales of 3.7x (ABOUT RIGHT)
However, slower annual revenue growth and lack of profitability could weigh on sentiment, particularly if investor expectations for continued momentum begin to fade.
Find out about the key risks to this StepStone Group narrative.
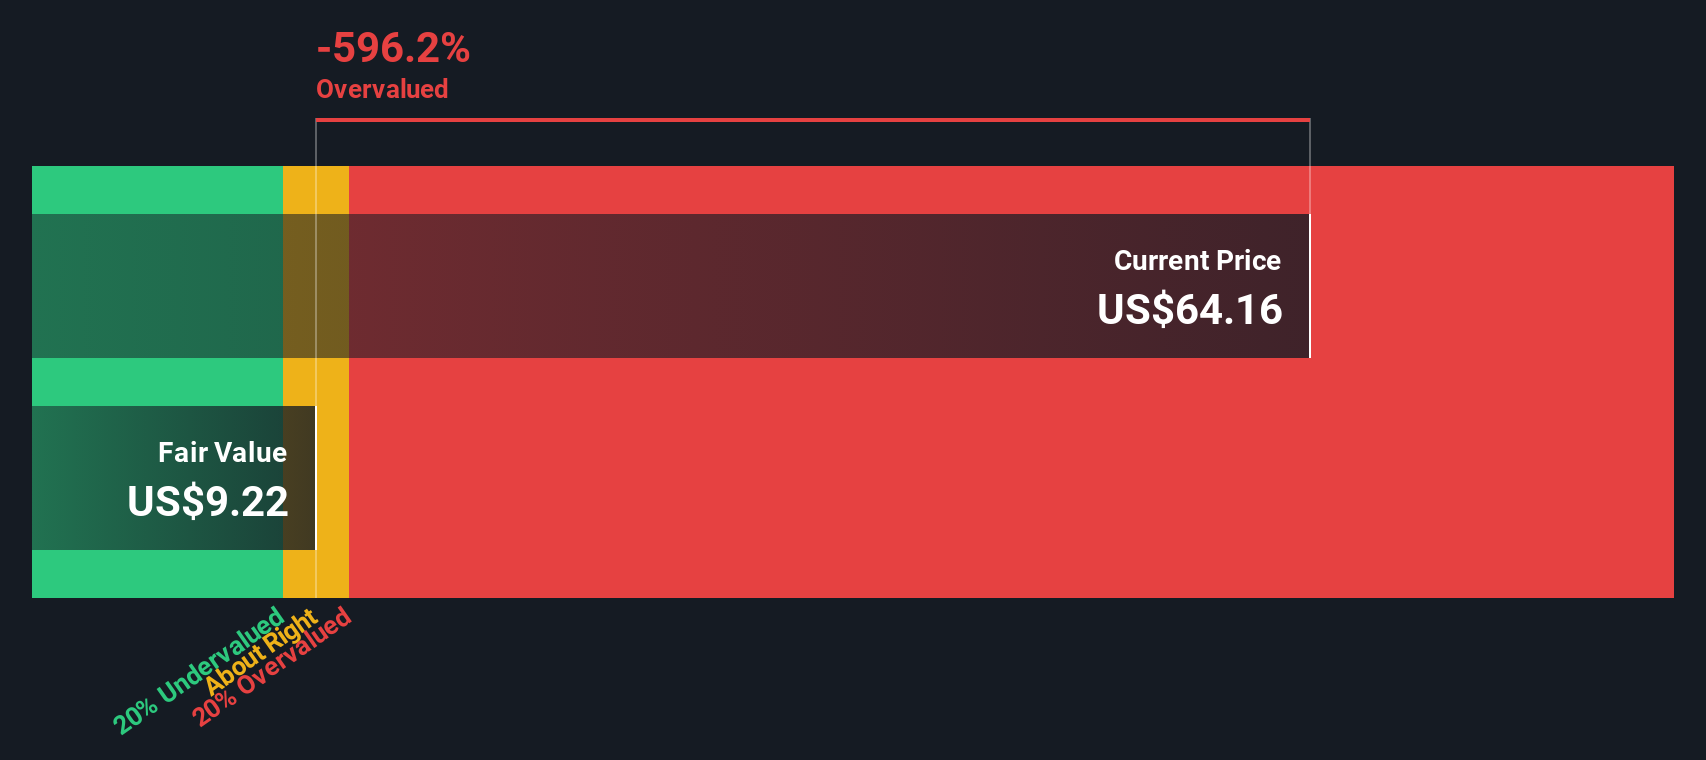
Another View: DCF Model Signals Overvaluation
Taking a different approach, our DCF model suggests StepStone might be sharply overvalued. The current share price of $64.55 sits well above our calculated fair value of $9.33. This raises the question: has the market’s optimism gone too far, or is there something the model is missing?
Look into how the SWS DCF model arrives at its fair value.
Simply Wall St performs a discounted cash flow (DCF) on every stock in the world every day (check out StepStone Group for example). We show the entire calculation in full. You can track the result in your watchlist or portfolio and be alerted when this changes, or use our stock screener to discover undervalued stocks based on their cash flows. If you save a screener we even alert you when new companies match - so you never miss a potential opportunity.
Build Your Own StepStone Group Narrative
Keep in mind, if the current breakdown does not fit your perspective or you like to dive into the numbers yourself, you can craft your own narrative in just a few minutes. Start with Do it your way.
A great starting point for your StepStone Group research is our analysis highlighting 2 important warning signs that could impact your investment decision.
Looking for more investment ideas?
Step up your strategy and stay ahead of the curve by tapping into fresh opportunities that could transform your portfolio. Don’t let the next trend pass you by. Smart moves start here.
- Tap into waves of innovation and spot tomorrow’s leaders among these 27 AI penny stocks as they shape the fast-growing artificial intelligence landscape.
- Secure steady income streams and build resilience with these 19 dividend stocks with yields > 3%, featuring companies offering dividend yields above 3%.
- Ride the momentum in digital finance and position yourself early with these 80 cryptocurrency and blockchain stocks by capitalizing on the surging interest in cryptocurrency and blockchain advancements.
This article by Simply Wall St is general in nature. We provide commentary based on historical data and analyst forecasts only using an unbiased methodology and our articles are not intended to be financial advice. It does not constitute a recommendation to buy or sell any stock, and does not take account of your objectives, or your financial situation. We aim to bring you long-term focused analysis driven by fundamental data. Note that our analysis may not factor in the latest price-sensitive company announcements or qualitative material. Simply Wall St has no position in any stocks mentioned.
New: Manage All Your Stock Portfolios in One Place
We've created the ultimate portfolio companion for stock investors, and it's free.
• Connect an unlimited number of Portfolios and see your total in one currency
• Be alerted to new Warning Signs or Risks via email or mobile
• Track the Fair Value of your stocks
Have feedback on this article? Concerned about the content? Get in touch with us directly. Alternatively, email editorial-team@simplywallst.com
About NasdaqGS:STEP
StepStone Group
A private equity and venture capital firm specializing in primary, direct, fund of funds, secondary direct, and secondary indirect investments.
Adequate balance sheet and slightly overvalued.
Similar Companies
Market Insights

Advertisement
Community Narratives
The company that turned a verb into a global necessity and basically runs the modern internet, digital ads, smartphones, maps, and AI.
Fair Value US$300.00|10.2% undervalued
OS
Community Contributor
Flowers Foods Pays A Fair Price For Health
Fair Value US$16.12|20.3% undervalued
NV
Community Contributor
TMX Group will thrive with 33.3% profit margin and enduring market moat
Fair Value CA$49.90|0.1% undervalued
LI
Community Contributor