Advertisement
- United States
- /
- Capital Markets
- /
- NasdaqGS:NDAQ
Is Nasdaq’s Recent Five-Year Run Justified by Its Current Valuation?

Simply Wall St
Reviewed by Bailey Pemberton
Thinking about what to do with Nasdaq stock? You are not alone. Whether you are sitting on sizeable returns or just eyeing the ticker for the first time, Nasdaq has been a standout performer both this year and over the longer term. With the stock closing recently at $88.82, it is up just 1.0% in the past week, 0.4% over the last month, but a more impressive 14.7% year-to-date and a remarkable 133.9% over the last five years. That sort of long-haul strength gets investors’ attention for good reason.
What is driving these latest moves? Recently, Nasdaq has been in the spotlight for a variety of reasons: its continued investment in market technology, growing demand for its cloud-based solutions, and steady progress in expanding outside traditional exchange business. These factors have buttressed a sense of growth potential, even as some market watchers keep an eye on broader volatility and tech sector shifts. It has not all been smooth sailing, but the ongoing transformation hints that Nasdaq is not just riding industry tides; it is helping shape them.
From a valuation standpoint, though, things get more interesting. Out of six key checks analysts use to judge value, Nasdaq meets just one criterion for being undervalued, earning a valuation score of 1. That suggests it is currently trading more in line with, or above, what typical models see as fair.
Of course, that is just scratching the surface. Coming up, we are going to dive into the specifics of these valuation methods, weigh what they mean for Nasdaq, and touch on a smarter way to think about value that many investors overlook.
Nasdaq scores just 1/6 on our valuation checks. See what other red flags we found in the full valuation breakdown.
Approach 1: Nasdaq Excess Returns Analysis
The Excess Returns valuation model assesses a company’s ability to generate returns on its invested capital that exceed the cost of that capital. For Nasdaq, this method focuses on how profitably management can deploy shareholder funds over time, rather than just focusing on traditional earnings or dividends.
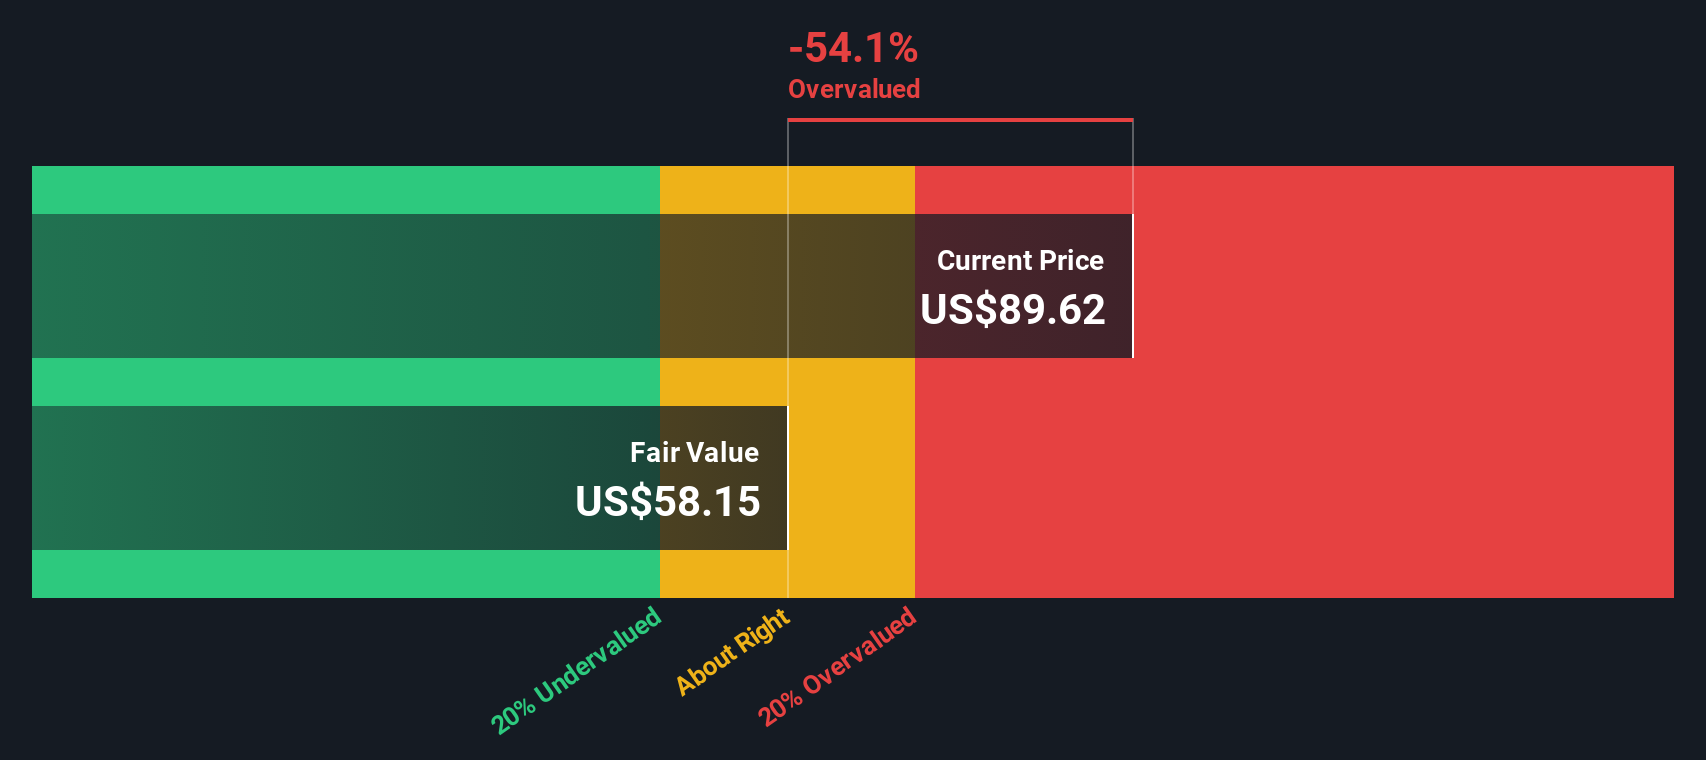
Looking at the numbers, Nasdaq has a book value of $20.97 per share and a stable earnings per share estimate of $3.94, based on projections from five analysts. The company’s cost of equity is $1.91 per share, leaving an excess return of $2.03 for each share of equity. This is evidence of consistent value creation. Nasdaq’s average return on equity is estimated at 17.56%, and its stable book value is projected to reach $22.42 per share with the help of expanding business segments and strong execution.
Based on this approach, the intrinsic value for Nasdaq shares stands at $59.69. Compared to the current price of $88.82, this implies a 48.8% overvaluation. While Nasdaq delivers returns above its cost of capital, investor optimism has pushed the stock price well above what the model considers its fair worth.
Result: OVERVALUED
Our Excess Returns analysis suggests Nasdaq may be overvalued by 48.8%. Find undervalued stocks or create your own screener to find better value opportunities.
Approach 2: Nasdaq Price vs Earnings
For profitable companies like Nasdaq, the price-to-earnings (PE) ratio is one of the most widely used and insightful valuation metrics. It provides a direct snapshot of how much investors are willing to pay today for each dollar of earnings, making it especially relevant when the company has a consistent profit history and a stable outlook.
The “right” PE ratio for any stock can vary depending on growth prospects, risk profile, and how investors perceive future opportunities. Higher expected growth and lower risk usually lead investors to justify higher PE ratios, whereas slower growth or greater risk tends to push this metric down.
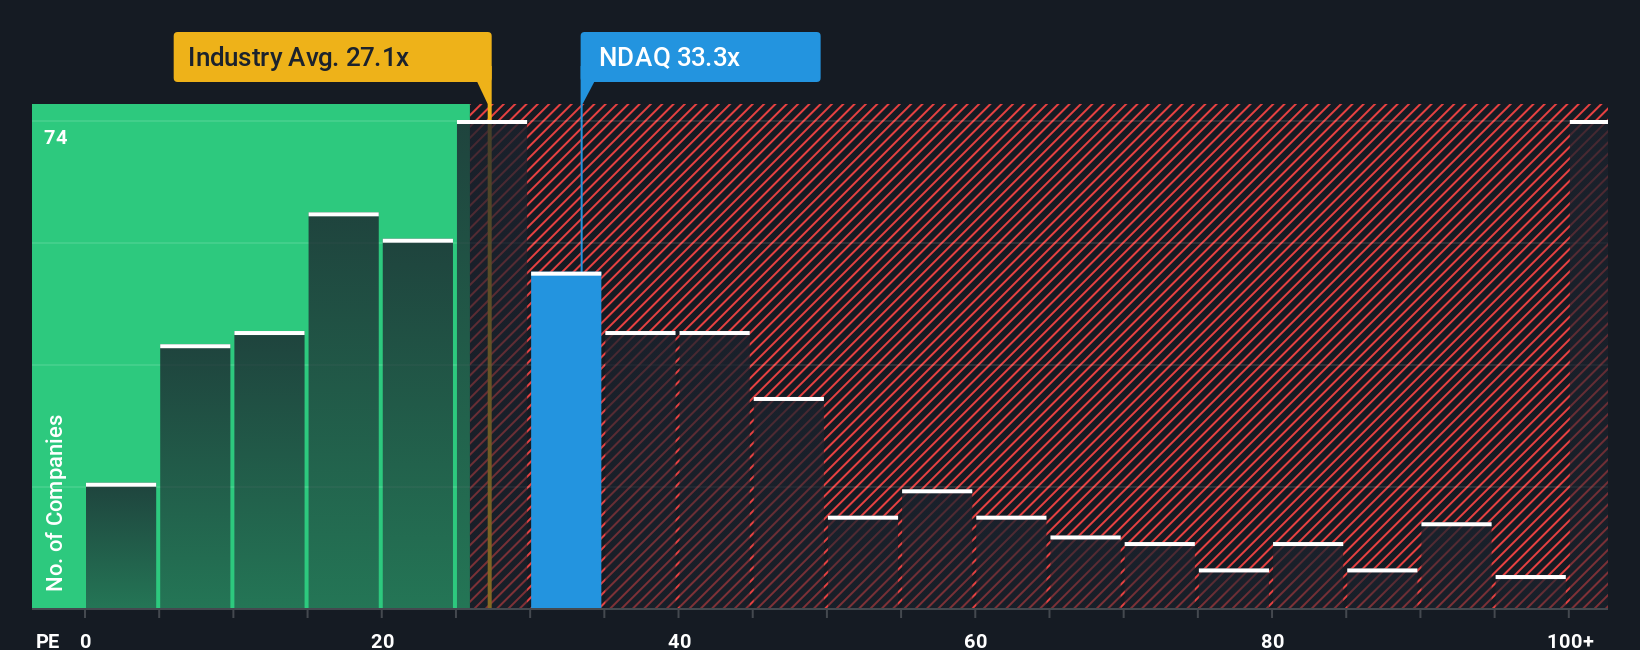
Currently, Nasdaq is trading at a PE ratio of 31.4x. This sits slightly below the peer average of 32.4x, but well above the broader capital markets industry average of 26.1x. However, comparing against peers and industry averages can only tell part of the story. That is where the Simply Wall St “Fair Ratio,” a figure custom-tailored to reflect Nasdaq’s own expected earnings growth, margins, industry dynamics, market cap, and risk, comes in. For Nasdaq, the Fair Ratio stands at 17.8x.
This Fair Ratio provides a more complete assessment than standard benchmarks, since it factors in not just where Nasdaq operates, but how it is projected to grow and what kinds of risks and profitability it faces in the years ahead. By weighing all these elements, the Fair Ratio is designed to give investors a more balanced view of value potential.
With the current PE of 31.4x sitting well above the Fair Ratio of 17.8x, the stock looks expensive relative to what its fundamentals would justify.
Result: OVERVALUED
PE ratios tell one story, but what if the real opportunity lies elsewhere? Discover companies where insiders are betting big on explosive growth.
Upgrade Your Decision Making: Choose your Nasdaq Narrative
Earlier, we mentioned that there is an even better way to understand valuation, so let us introduce you to Narratives. A Narrative is simply your unique perspective or story about how a company will perform, linking what you expect for its future revenue, profit margins, and fair value to what you believe is realistic or probable. Rather than just focusing on numbers, Narratives connect the company’s long-term story with a dynamic financial forecast, helping you decide whether the current price is attractive or not.
On Simply Wall St’s Community page, millions of investors use Narratives as an easy-to-access tool to compare their fair value estimates to the market price, see how their views stack up against consensus, and update their stance whenever new information like news or earnings arrives. For example, when it comes to Nasdaq, the most bullish investor Narrative puts fair value at $115, while the lowest sees it at $74, reflecting very different expectations for future growth and profitability. Narratives make it easy to see these differences and adjust your own decisions with real-time transparency.
Do you think there's more to the story for Nasdaq? Create your own Narrative to let the Community know!

This article by Simply Wall St is general in nature. We provide commentary based on historical data and analyst forecasts only using an unbiased methodology and our articles are not intended to be financial advice. It does not constitute a recommendation to buy or sell any stock, and does not take account of your objectives, or your financial situation. We aim to bring you long-term focused analysis driven by fundamental data. Note that our analysis may not factor in the latest price-sensitive company announcements or qualitative material. Simply Wall St has no position in any stocks mentioned.
Valuation is complex, but we're here to simplify it.
Discover if Nasdaq might be undervalued or overvalued with our detailed analysis, featuring fair value estimates, potential risks, dividends, insider trades, and its financial condition.
Access Free AnalysisHave feedback on this article? Concerned about the content? Get in touch with us directly. Alternatively, email editorial-team@simplywallst.com
About NasdaqGS:NDAQ
Nasdaq
Operates as a technology company that serves capital markets and other industries worldwide.
Solid track record average dividend payer.
Similar Companies
Market Insights

Advertisement
Community Narratives
Finding The True Value Of A Logistics Powerhouse
Fair Value US$95.21|8.6% undervalued
NV
Community Contributor
Paradigm Biopharmaceuticals Will Lead Osteoarthritis Treatment with Zilosul's FDA Success
Fair Value AU$5.50|92.1% undervalued
AM
Community Contributor
Barrick Mining (ABX:CA): A Gold Hedge against a U.S. Shutdown
Fair Value CA$60.00|25.6% undervalued
GM
Community Contributor