Advertisement
- United States
- /
- Consumer Services
- /
- NYSE:STUB
StubHub Holdings (STUB): Evaluating Valuation After Recent Share Price Momentum

Simply Wall St
Reviewed by Simply Wall St
StubHub Holdings (STUB) has drawn investor interest recently, with its stock climbing 14% over the past month. This momentum is reflected in the company reporting strong annual revenue and net income growth, even though it has posted an overall negative year-to-date return.
See our latest analysis for StubHub Holdings.
StubHub’s 14% one-month share price return signals growing optimism as investors respond to upbeat annual results, even though the year-to-date share price return remains in negative territory. The recent price action suggests that positive sentiment may be building following earlier headwinds.
If you want to spot other pockets of momentum right now, consider broadening your search and discover fast growing stocks with high insider ownership
With strong sales growth yet a negative year-to-date return, investors now face a critical question: does StubHub’s recent rally mean shares remain undervalued, or is the market already pricing in future gains?
Price-to-Sales Ratio of 4x: Is it justified?
StubHub Holdings is currently trading at a price-to-sales (P/S) ratio of 4x, notably higher than both its direct peers and the US Consumer Services industry average. This elevated multiple suggests the market is assigning a significant premium to its sales, possibly reflecting optimism about future growth or profitability.
The price-to-sales ratio compares a company’s share price to its revenues, offering insight into how much investors are willing to pay for each dollar of revenue generated. For businesses like StubHub that are not yet profitable, the P/S ratio is often more meaningful than earnings ratios. It serves as a barometer of perceived growth prospects and potential scale benefits.
However, with the peer average at 2.1x and the broader industry average at just 1.5x, StubHub stands out as expensive by comparison. Unless future revenue growth consistently outpaces these benchmarks, the current multiple could indicate over-exuberance rather than sustainable value at today’s share price.
See what the numbers say about this price — find out in our valuation breakdown.
Result: Price-to-Sales of 4x (OVERVALUED)
However, uncertainty remains, as persistent net losses and a recent negative year-to-date return could challenge the sustainability of StubHub’s recent momentum.
Find out about the key risks to this StubHub Holdings narrative.
Another View: Discounted Cash Flow Signals Undervaluation
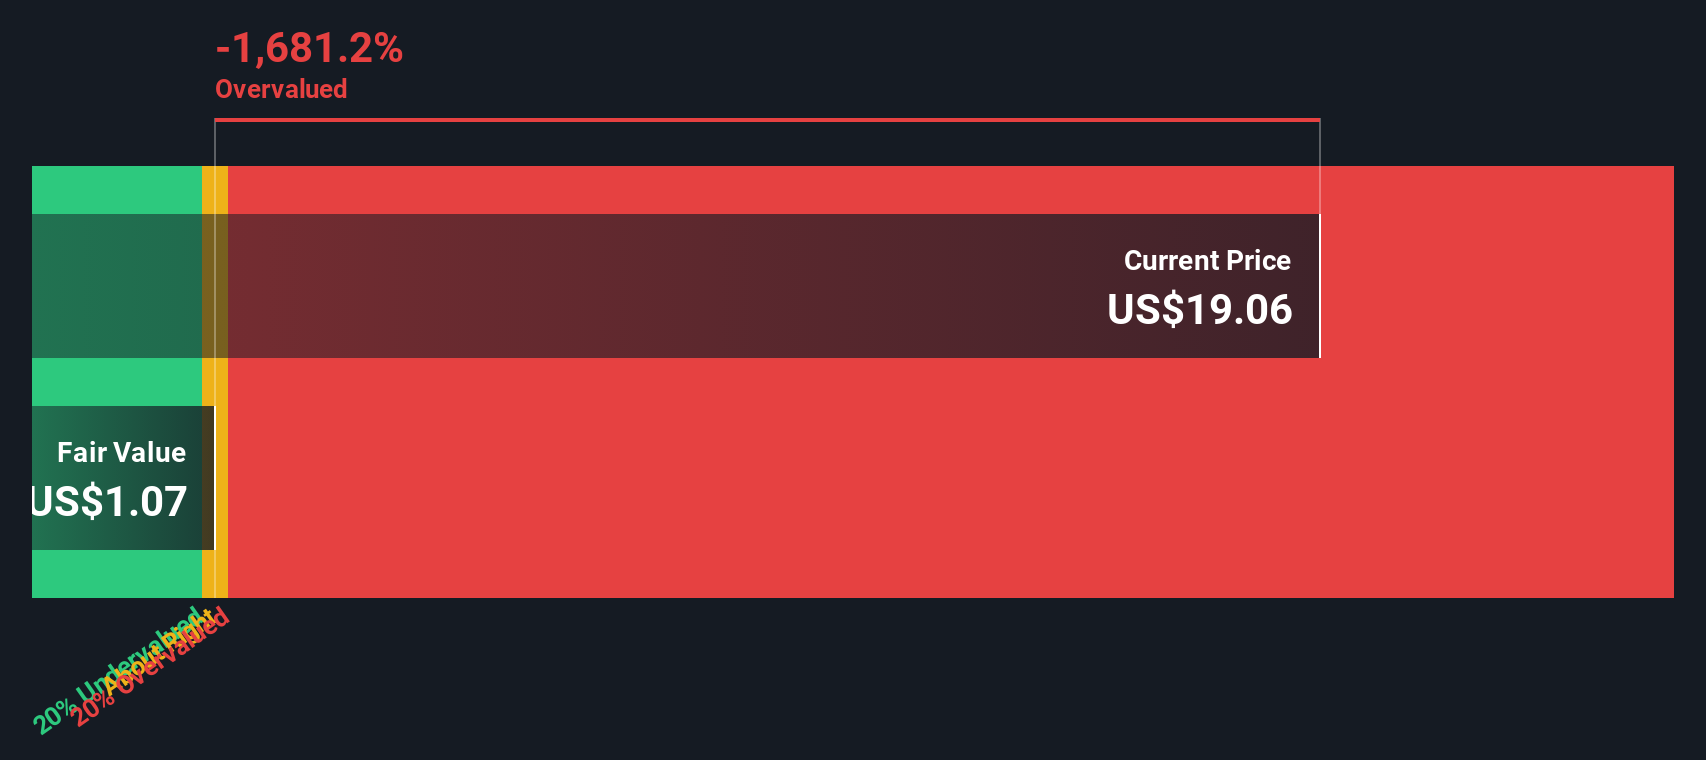
While StubHub’s elevated price-to-sales ratio paints an expensive picture compared to peers, our SWS DCF model offers a strikingly different take. It suggests StubHub’s shares are trading 92.9% below its estimated fair value, indicating significant undervaluation at current prices. Could the market be missing a long-term growth opportunity?
Look into how the SWS DCF model arrives at its fair value.
Simply Wall St performs a discounted cash flow (DCF) on every stock in the world every day (check out StubHub Holdings for example). We show the entire calculation in full. You can track the result in your watchlist or portfolio and be alerted when this changes, or use our stock screener to discover 848 undervalued stocks based on their cash flows. If you save a screener we even alert you when new companies match - so you never miss a potential opportunity.
Build Your Own StubHub Holdings Narrative
If you think there is more to the story, or want to weigh the numbers for yourself, you can craft an independent view in just a few minutes. Do it your way
A good starting point is our analysis highlighting 2 key rewards investors are optimistic about regarding StubHub Holdings.
Looking for More Investment Ideas?
Make your next move count by checking out high-potential stocks beyond StubHub. You could spot your next breakout winner by acting now rather than waiting for the crowd.
- Tap into the future of medical technology and breakthroughs with these 34 healthcare AI stocks before these opportunities attract wider attention.
- Boost your income stream by targeting these 21 dividend stocks with yields > 3%, which offers reliable yields above 3% to strengthen your portfolio’s balance and growth.
- Get ahead of surging market trends and volatility by evaluating these 81 cryptocurrency and blockchain stocks as they transform the digital payments landscape.
This article by Simply Wall St is general in nature. We provide commentary based on historical data and analyst forecasts only using an unbiased methodology and our articles are not intended to be financial advice. It does not constitute a recommendation to buy or sell any stock, and does not take account of your objectives, or your financial situation. We aim to bring you long-term focused analysis driven by fundamental data. Note that our analysis may not factor in the latest price-sensitive company announcements or qualitative material. Simply Wall St has no position in any stocks mentioned.
New: Manage All Your Stock Portfolios in One Place
We've created the ultimate portfolio companion for stock investors, and it's free.
• Connect an unlimited number of Portfolios and see your total in one currency
• Be alerted to new Warning Signs or Risks via email or mobile
• Track the Fair Value of your stocks
Have feedback on this article? Concerned about the content? Get in touch with us directly. Alternatively, email editorial-team@simplywallst.com
About NYSE:STUB
StubHub Holdings
Operates ticketing marketplace for live event tickets worldwide.
High growth potential with mediocre balance sheet.
Market Insights

Advertisement
Community Narratives
The company that turned a verb into a global necessity and basically runs the modern internet, digital ads, smartphones, maps, and AI.
Fair Value US$300.00|8.5% undervalued
OS
Community Contributor
Flowers Foods Pays A Fair Price For Health
Fair Value US$16.12|24.6% undervalued
NV
Community Contributor
TMX Group will thrive with 33.3% profit margin and enduring market moat
Fair Value CA$49.90|0.1% undervalued
LI
Community Contributor