Graham Holdings (GHC) shares have caught the eye of investors after the company posted steady revenue growth over the past year. Its stock climbed 2% in the latest session, following a solid 5% annual top-line increase.
Graham Holdings’ share price momentum has picked up after its recent gains, with a 1-day share price return of 2.6% reversing much of last month’s pullback. Despite some short-term volatility, the stock has delivered a standout 22.5% share price return for the year to date and an impressive 35.3% total shareholder return over the past 12 months. This highlights sustained long-term value creation.
With shares rallying and annual returns outpacing the market, the key question is whether Graham Holdings is still trading below its intrinsic value or if investors have already priced in its future growth prospects.
Advertisement
Price-to-Earnings of 6.8x: Is it justified?
Graham Holdings is trading at a price-to-earnings ratio of just 6.8x, markedly below both its Consumer Services industry peers and the broader market. With a last close price of $1,060.36, the stock appears significantly undervalued on this multiple compared to similar companies.
The price-to-earnings (P/E) ratio gauges how much investors are willing to pay for a company’s earnings. For a diversified services business like Graham Holdings, a lower-than-average P/E could indicate that the market is not fully recognizing its profit potential or its record of strong earnings growth.
Notably, Graham Holdings’ P/E of 6.8x is well below the Consumer Services industry average of 18.9x and also much lower than the peer group’s 24.5x average. This substantial difference suggests the market may be discounting Graham Holdings’ recent outperformance, even after a year of strong profit growth.
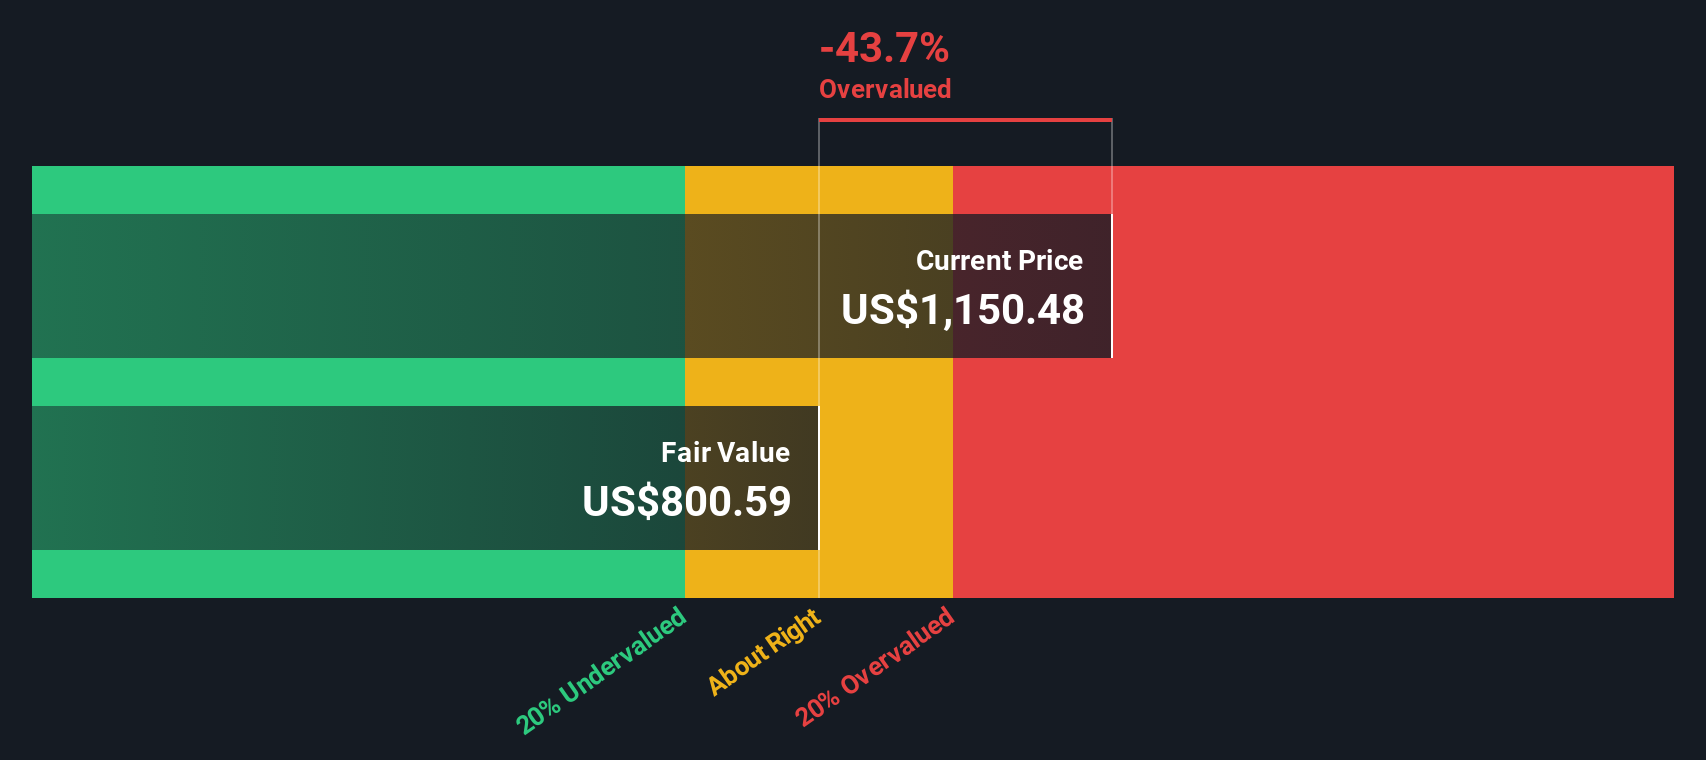
Looking from another angle, the SWS DCF model estimates Graham Holdings' fair value at $1,229.87 per share, about 13.8% above the current price. This signals potential undervaluation and supports what the earnings multiple suggests. Could the market be missing something in its recent enthusiasm?
Simply Wall St performs a discounted cash flow (DCF) on every stock in the world every day (check out Graham Holdings for example). We show the entire calculation in full. You can track the result in your watchlist or portfolio and be alerted when this changes, or use our stock screener to discover undervalued stocks based on their cash flows. If you save a screener we even alert you when new companies match - so you never miss a potential opportunity.
Build Your Own Graham Holdings Narrative
If you want to explore the numbers from a different angle or consider your own thesis, you can build your own take in just a few minutes with Do it your way.
A good starting point is our analysis highlighting 2 key rewards investors are optimistic about regarding Graham Holdings.
Looking for more investment ideas?
Smart moves start with smart research. Don’t limit yourself. Uncover more high-potential stocks, strong dividend payers, or tech breakthroughs before the rest of the market acts.
Unlock higher portfolio returns by targeting true value opportunities when you review these 866 undervalued stocks based on cash flows delivering exceptional potential based on solid cash flows.
Get ahead of the curve in artificial intelligence with these 26 AI penny stocks spotlighting companies shaping tomorrow’s industry and redefining what’s possible.
This article by Simply Wall St is general in nature. We provide commentary based on historical data
and analyst forecasts only using an unbiased methodology and our articles are not intended to be financial advice. It does not constitute a recommendation to buy or sell any stock, and does not take account of your objectives, or your
financial situation. We aim to bring you long-term focused analysis driven by fundamental data.
Note that our analysis may not factor in the latest price-sensitive company announcements or qualitative material.
Simply Wall St has no position in any stocks mentioned.
New: Manage All Your Stock Portfolios in One Place
We've created the ultimate portfolio companion for stock investors, and it's free.
• Connect an unlimited number of Portfolios and see your total in one currency • Be alerted to new Warning Signs or Risks via email or mobile • Track the Fair Value of your stocks