Advertisement
- United States
- /
- Hospitality
- /
- NasdaqGS:SABR
Sabre (SABR): Earnings Set to Soar 87.8% Annually, But Revenue Growth Lags US Market

Simply Wall St
Reviewed by Simply Wall St
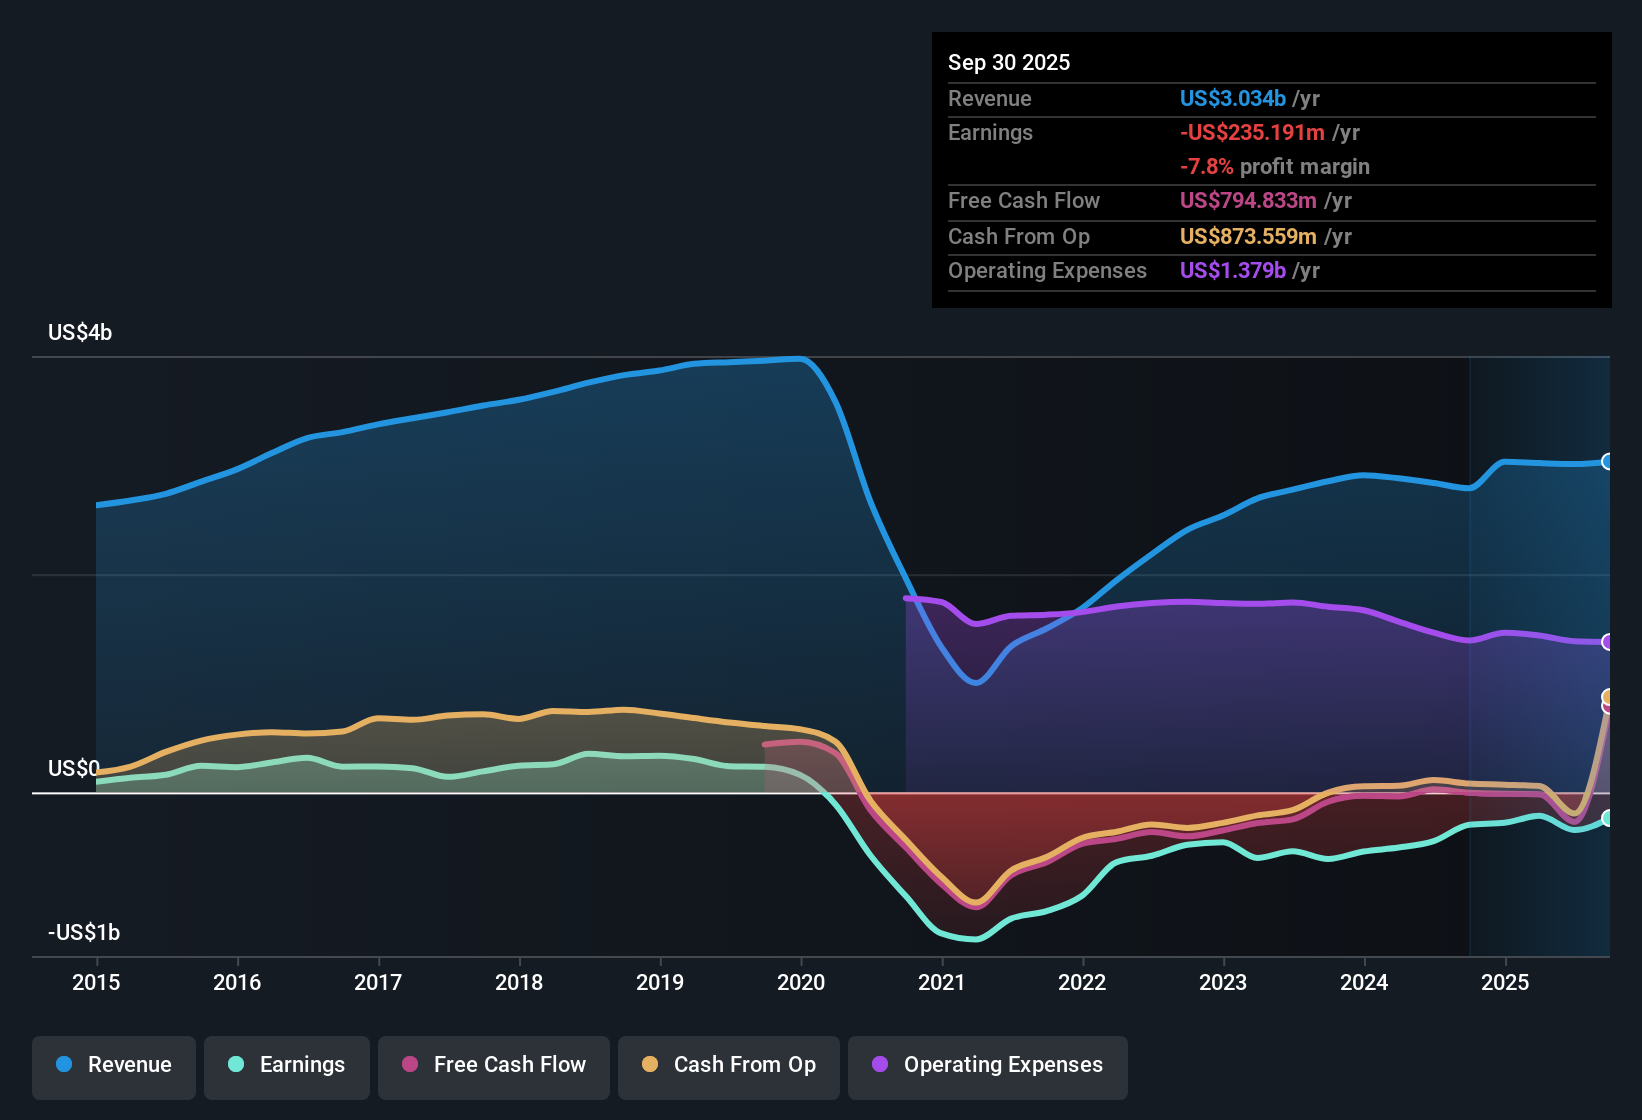
Sabre (SABR) has narrowed its losses by 30.8% per year over the past five years, while earnings are forecast to surge 87.83% per year with expectations of reaching profitability within the next three years. Despite this positive momentum in profitability, revenue is projected to grow at just 3.1% annually, trailing the broader US market's 10.5%. With shares trading at $2, well below the estimated fair value of $4.47, investors are weighing improving earnings prospects against recent share price instability and current financial risks.
See our full analysis for Sabre.Now let’s see how the latest results compare to the most closely watched narratives for Sabre. This is where the numbers might reinforce or challenge the market’s big picture.
See what the community is saying about Sabre
Margins Poised for Turnaround in 3 Years
- Profit margins are forecast to swing from -11.5% today to positive 0.9% within three years. This reflects analysts’ optimism in Sabre’s path to profitability after years of red ink.
- According to the analysts' consensus view, this margin reversal is anchored in:
- expectations that enhanced AI-powered platforms and cloud technology adoption will increase operational efficiency while containing expenses, supporting the forecasted net margin improvement,
- and projections that normalization in global travel and diversified content integration will support more durable customer relationships, underpinning Sabre’s rebound in net profitability despite current segment pressures.
Debt Reduction Boosts Financial Flexibility
- Sabre has paid down over $1 billion in debt in 2025, giving the company more flexibility to invest in innovation and withstand unexpected downturns in travel demand.
- Consensus narrative highlights that strengthened balance sheet fundamentals contribute to:
- greater free cash flow generation, allowing more strategic moves such as expanding cross-selling of ancillary services,
- and a more resilient position to navigate shifts toward direct-booking models, even as competition among travel tech providers intensifies.
Value Signals Flash Green, but Discount Isn’t Without Risks
- Shares trade at $2, significantly below the DCF fair value of $4.47. Sabre’s Price-to-Sales ratio of just 0.3x is lower than both its industry (1.6x) and direct peers (1.4x), pointing to material undervaluation on multiple fronts.
- Analysts’ consensus view notes the discount gap is tempered by:
- persistent share price instability over the past three months and Sabre’s ongoing negative equity, both of which suggest that attractive valuation is at least partly a reward for investors willing to accept higher risk,
- and the fact that, even if Sabre grows into analyst price targets of $2.66, the implied 61.1x PE on 2028 earnings would still put the shares at a steep premium compared to today’s industry norms.
Next Steps
To see how these results tie into long-term growth, risks, and valuation, check out the full range of community narratives for Sabre on Simply Wall St. Add the company to your watchlist or portfolio so you'll be alerted when the story evolves.
Have a fresh take on the numbers? Share your point of view. It only takes a few minutes to craft your unique story. Do it your way
A great starting point for your Sabre research is our analysis highlighting 4 key rewards and 2 important warning signs that could impact your investment decision.
See What Else Is Out There
Despite Sabre's turnaround potential, persistent negative equity, ongoing losses, and recent share price instability raise red flags about its financial resilience.
If you want stocks trading at a discount but backed by stronger fundamentals, use solid balance sheet and fundamentals stocks screener (1979 results) to target companies with healthier balance sheets and more robust financial health.
This article by Simply Wall St is general in nature. We provide commentary based on historical data and analyst forecasts only using an unbiased methodology and our articles are not intended to be financial advice. It does not constitute a recommendation to buy or sell any stock, and does not take account of your objectives, or your financial situation. We aim to bring you long-term focused analysis driven by fundamental data. Note that our analysis may not factor in the latest price-sensitive company announcements or qualitative material. Simply Wall St has no position in any stocks mentioned.
New: Manage All Your Stock Portfolios in One Place
We've created the ultimate portfolio companion for stock investors, and it's free.
• Connect an unlimited number of Portfolios and see your total in one currency
• Be alerted to new Warning Signs or Risks via email or mobile
• Track the Fair Value of your stocks
Have feedback on this article? Concerned about the content? Get in touch with us directly. Alternatively, email editorial-team@simplywallst.com
About NasdaqGS:SABR
Sabre
Operates as a software and technology company for travel industry in the United States, Europe, Asia-Pacific, and internationally.
Undervalued with moderate growth potential.
Similar Companies
Market Insights

Advertisement
Community Narratives
The company that turned a verb into a global necessity and basically runs the modern internet, digital ads, smartphones, maps, and AI.
Fair Value US$300.00|5.2% undervalued
OS
Community Contributor
Flowers Foods Pays A Fair Price For Health
Fair Value US$16.12|24.9% undervalued
NV
Community Contributor
TMX Group will thrive with 33.3% profit margin and enduring market moat
Fair Value CA$49.90|3.3% overvalued
LI
Community Contributor
The "Molecular Pencil": Why Beam's Technology is Built to Win
Fair Value US$65.01|64.5% undervalued
DA
Community Contributor