- United States
- /
- Hospitality
- /
- NasdaqGS:PLAY
Despite lower earnings than three years ago, Dave & Buster's Entertainment (NASDAQ:PLAY) investors are up 200% since then


Dave & Buster's Entertainment, Inc. (NASDAQ:PLAY) shareholders might be concerned after seeing the share price drop 15% in the last quarter. But that doesn't change the fact that the returns over the last three years have been very strong. The share price marched upwards over that time, and is now 200% higher than it was. After a run like that some may not be surprised to see prices moderate. The thing to consider is whether the underlying business is doing well enough to support the current price.
In light of the stock dropping 4.9% in the past week, we want to investigate the longer term story, and see if fundamentals have been the driver of the company's positive three-year return.
View our latest analysis for Dave & Buster's Entertainment
SWOT Analysis for Dave & Buster's Entertainment
- Earnings growth over the past year exceeded the industry.
- Debt is well covered by earnings and cashflows.
- No major weaknesses identified for PLAY.
- Annual earnings are forecast to grow faster than the American market.
- Good value based on P/E ratio compared to estimated Fair P/E ratio.
- Revenue is forecast to grow slower than 20% per year.
To quote Buffett, 'Ships will sail around the world but the Flat Earth Society will flourish. There will continue to be wide discrepancies between price and value in the marketplace...' One flawed but reasonable way to assess how sentiment around a company has changed is to compare the earnings per share (EPS) with the share price.
Over the last three years, Dave & Buster's Entertainment failed to grow earnings per share, which fell 1.9% (annualized).
Based on these numbers, we think that the decline in earnings per share may not be a good representation of how the business has changed over the years. So other metrics may hold the key to understanding what is influencing investors.
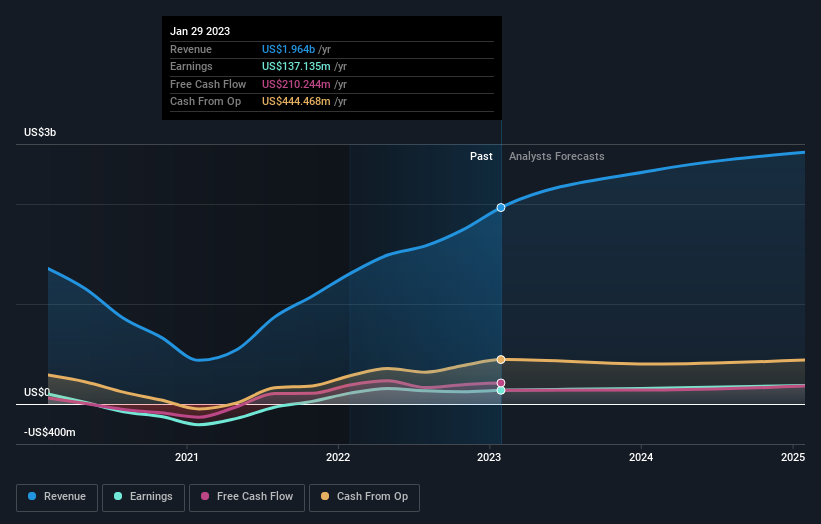
It may well be that Dave & Buster's Entertainment revenue growth rate of 27% over three years has convinced shareholders to believe in a brighter future. If the company is being managed for the long term good, today's shareholders might be right to hold on.
You can see how earnings and revenue have changed over time in the image below (click on the chart to see the exact values).
We like that insiders have been buying shares in the last twelve months. Having said that, most people consider earnings and revenue growth trends to be a more meaningful guide to the business. If you are thinking of buying or selling Dave & Buster's Entertainment stock, you should check out this free report showing analyst profit forecasts.
A Different Perspective
We regret to report that Dave & Buster's Entertainment shareholders are down 29% for the year. Unfortunately, that's worse than the broader market decline of 7.7%. Having said that, it's inevitable that some stocks will be oversold in a falling market. The key is to keep your eyes on the fundamental developments. Unfortunately, last year's performance may indicate unresolved challenges, given that it was worse than the annualised loss of 3% over the last half decade. We realise that Baron Rothschild has said investors should "buy when there is blood on the streets", but we caution that investors should first be sure they are buying a high quality business. It's always interesting to track share price performance over the longer term. But to understand Dave & Buster's Entertainment better, we need to consider many other factors. For instance, we've identified 1 warning sign for Dave & Buster's Entertainment that you should be aware of.
Dave & Buster's Entertainment is not the only stock insiders are buying. So take a peek at this free list of growing companies with insider buying.
Please note, the market returns quoted in this article reflect the market weighted average returns of stocks that currently trade on American exchanges.
New: Manage All Your Stock Portfolios in One Place
We've created the ultimate portfolio companion for stock investors, and it's free.
• Connect an unlimited number of Portfolios and see your total in one currency
• Be alerted to new Warning Signs or Risks via email or mobile
• Track the Fair Value of your stocks
Have feedback on this article? Concerned about the content? Get in touch with us directly. Alternatively, email editorial-team (at) simplywallst.com.
This article by Simply Wall St is general in nature. We provide commentary based on historical data and analyst forecasts only using an unbiased methodology and our articles are not intended to be financial advice. It does not constitute a recommendation to buy or sell any stock, and does not take account of your objectives, or your financial situation. We aim to bring you long-term focused analysis driven by fundamental data. Note that our analysis may not factor in the latest price-sensitive company announcements or qualitative material. Simply Wall St has no position in any stocks mentioned.
About NasdaqGS:PLAY
Dave & Buster's Entertainment
Owns and operates entertainment and dining venues for adults and families in North America.
Reasonable growth potential and fair value.

