Advertisement
- United States
- /
- Hospitality
- /
- NasdaqGS:MCRI
Monarch Casino & Resort (MCRI): Evaluating Valuation After Strong Q3 Results, Dividend Affirmation, and Buybacks

Simply Wall St
Reviewed by Simply Wall St
Monarch Casino & Resort (MCRI) just rolled out a wave of news that has investors paying close attention. After posting improved third quarter results, the company also affirmed its quarterly dividend and reported recent share buybacks.
See our latest analysis for Monarch Casino & Resort.
Monarch Casino & Resort’s recent flurry of upbeat announcements has energized the stock’s momentum, with investors reacting to rising revenues, robust earnings, continued buybacks, and a sustainable dividend. Over the last year, the company has achieved a total shareholder return of 16.34%, reflecting solid long-term growth and renewed confidence around its outlook.
If these moves have sparked your curiosity, this could be the perfect moment to broaden your investing lens and discover fast growing stocks with high insider ownership
With a strong balance sheet and shares still trading well below analyst price targets, the key question is whether Monarch Casino & Resort is genuinely undervalued or if the market has already factored in all that future growth.
Price-to-Earnings of 19.9x: Is it justified?
Monarch Casino & Resort trades on a price-to-earnings (P/E) ratio of 19.9x, which places it below the industry average and above the fair value implied by regression models. With shares closing at $90.07, the stock looks attractively priced compared to US Hospitality peers while still prompting questions about earnings sustainability.
The price-to-earnings ratio is a classic measure that captures how much investors are willing to pay today for a dollar of future earnings. For Monarch Casino & Resort, this multiple signals what the market expects for its profit trajectory and business quality in the casino and hospitality sector.
The current P/E looks appealing next to both the industry average of 23.3x and peer group average of 24.8x, putting Monarch in the value spotlight. However, the fair value regression suggests a P/E closer to 16.8x might be warranted, indicating the stock trades at a premium to modeled fair value. Should fundamentals shift, there is room for the market to gravitate toward that lower level.
Explore the SWS fair ratio for Monarch Casino & Resort
Result: Price-to-Earnings of 19.9x (ABOUT RIGHT)
However, slowing revenue growth and a premium to modeled fair value serve as reminders that future gains depend on sustained operational execution.
Find out about the key risks to this Monarch Casino & Resort narrative.
Another View: Discounted Cash Flow Signals Undervaluation
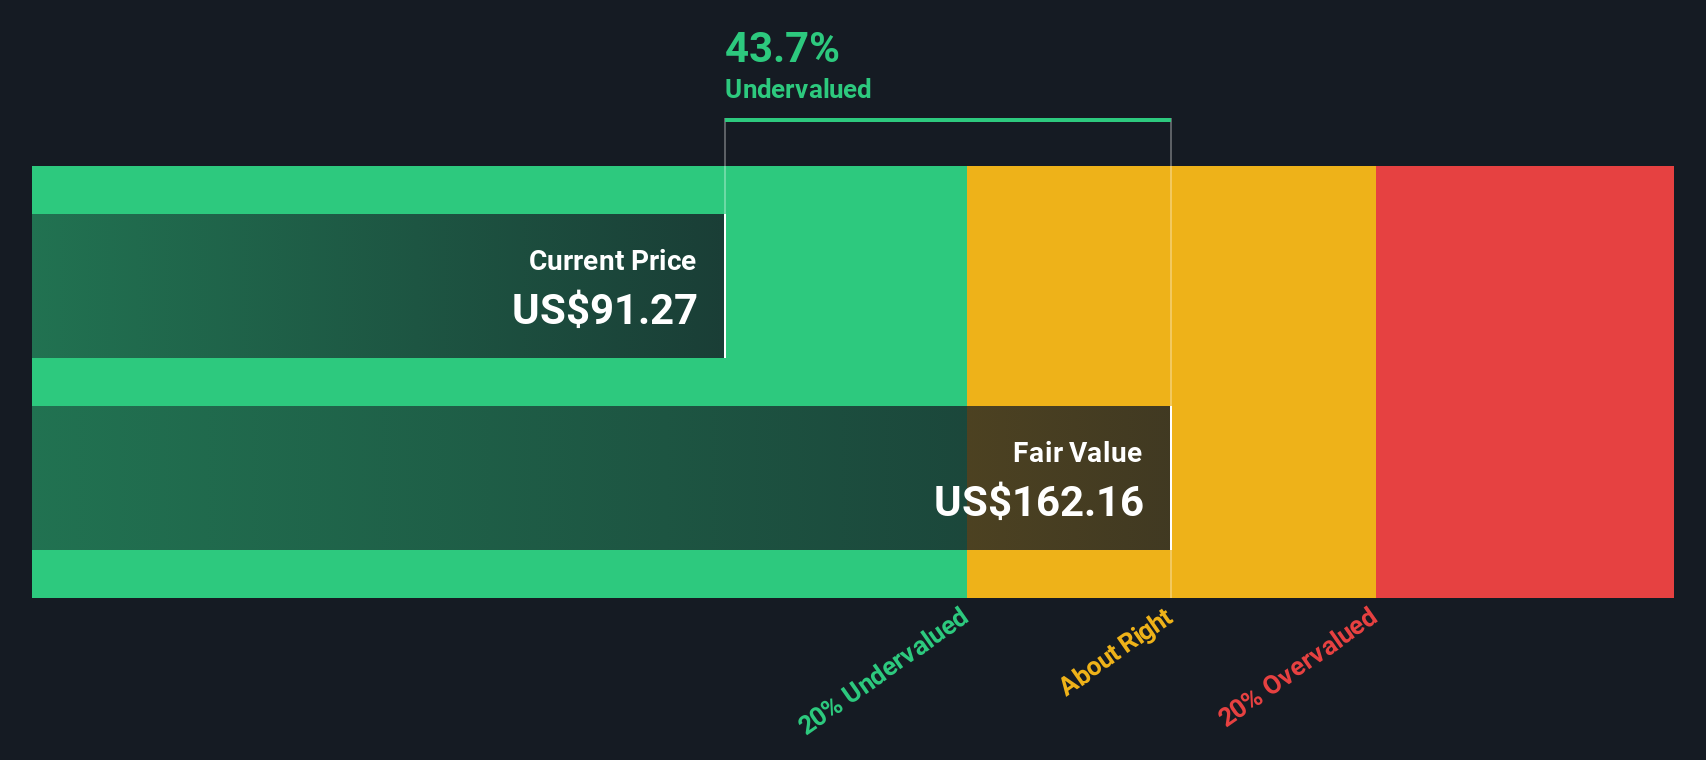
While the price-to-earnings approach shows Monarch Casino & Resort at a modest premium to its fair ratio, our DCF model presents a different perspective. The SWS DCF model estimates a fair value of $157.34 per share, which is significantly higher than the recent market price. Could the market be underappreciating this casino operator’s future cash flows?
Look into how the SWS DCF model arrives at its fair value.
Simply Wall St performs a discounted cash flow (DCF) on every stock in the world every day (check out Monarch Casino & Resort for example). We show the entire calculation in full. You can track the result in your watchlist or portfolio and be alerted when this changes, or use our stock screener to discover 841 undervalued stocks based on their cash flows. If you save a screener we even alert you when new companies match - so you never miss a potential opportunity.
Build Your Own Monarch Casino & Resort Narrative
If you would like to interpret the numbers from your own angle, you can tailor a personal Monarch Casino & Resort investment story in just a few minutes, so Do it your way
A great starting point for your Monarch Casino & Resort research is our analysis highlighting 2 key rewards and 1 important warning sign that could impact your investment decision.
Looking for more investment ideas?
Smart investors always keep an eye open for promising opportunities beyond the obvious picks. Don’t let great stocks pass you by. Put the Simply Wall Street Screener to work and spot your next advantage in the market.
- Spot firms rewarding shareholders with robust payouts and strong yields by checking out these 20 dividend stocks with yields > 3% today.
- Catch early momentum in companies pioneering artificial intelligence when you scan these 27 AI penny stocks packed with trailblazers redefining innovation.
- Find undervalued stocks that could boost your returns by browsing these 841 undervalued stocks based on cash flows selected for their attractive cash flow potential.
This article by Simply Wall St is general in nature. We provide commentary based on historical data and analyst forecasts only using an unbiased methodology and our articles are not intended to be financial advice. It does not constitute a recommendation to buy or sell any stock, and does not take account of your objectives, or your financial situation. We aim to bring you long-term focused analysis driven by fundamental data. Note that our analysis may not factor in the latest price-sensitive company announcements or qualitative material. Simply Wall St has no position in any stocks mentioned.
New: Manage All Your Stock Portfolios in One Place
We've created the ultimate portfolio companion for stock investors, and it's free.
• Connect an unlimited number of Portfolios and see your total in one currency
• Be alerted to new Warning Signs or Risks via email or mobile
• Track the Fair Value of your stocks
Have feedback on this article? Concerned about the content? Get in touch with us directly. Alternatively, email editorial-team@simplywallst.com
About NasdaqGS:MCRI
Monarch Casino & Resort
Through its subsidiaries, owns and operates hotels and casinos.
Excellent balance sheet and good value.
Similar Companies
Market Insights

Advertisement
Community Narratives
The company that turned a verb into a global necessity and basically runs the modern internet, digital ads, smartphones, maps, and AI.
Fair Value US$300.00|6.3% undervalued
OS
Community Contributor
Flowers Foods Pays A Fair Price For Health
Fair Value US$16.12|26.0% undervalued
NV
Community Contributor
TMX Group will thrive with 33.3% profit margin and enduring market moat
Fair Value CA$49.90|3.7% overvalued
LI
Community Contributor