- United States
- /
- Food and Staples Retail
- /
- NasdaqGS:CART
Evaluating Maplebear After the Recent Strategic Partnership and Stock Price Shift

Reviewed by Bailey Pemberton
If you are staring at Maplebear's stock chart and wondering if now is the moment to get in, stay put. Let’s take a closer look together. Whether you have watched the stock’s ups and downs from the sidelines or held through the turbulence, recent market moves have offered plenty of conversation starters. Over the past week, Maplebear’s share price nudged up by 1.1%, which is a welcome change after a bumpy 30-day slide of -7.1%. Year to date, shares are down -8.4%, and the 1-year return shows a -10.0% dip. These numbers reflect a company in the spotlight, a business that’s adapting to new headwinds and fresh opportunities.
Recently, news has centered on Maplebear’s progress in expanding its delivery services into new markets, with some headlines highlighting a high-profile strategic partnership. While this development is promising and could boost long-term growth ambitions, investors are still weighing how quickly it might translate into real results. It's this push and pull, innovation versus execution, that often sparks bigger swings in perceived value and risk.
So where does Maplebear stand on the valuation scorecard? Out of six standard checks for undervaluation, Maplebear ticks the box on three of them, giving it a valuation score of 3. Not bad, but the real story comes out when we dig into those checks themselves. Up next, we’ll break down which valuation methods matter most, how Maplebear stacks up, and, importantly, a smarter way to see what the numbers might be missing.
Why Maplebear is lagging behind its peers
Approach 1: Maplebear Discounted Cash Flow (DCF) Analysis
The Discounted Cash Flow (DCF) model estimates a company’s intrinsic value by projecting its future cash flows and discounting them back to today’s dollars. For Maplebear, this approach starts with its latest Free Cash Flow (FCF) of $777 million, reflecting the cash the business generates after expenses. Analyst forecasts suggest FCF will grow in the coming years, reaching $1.2 billion by 2029. Beyond analyst projections, further growth is extrapolated, but those estimates become less certain the further out they go.
All cash flows are expressed in dollars, in line with the company’s reporting currency. The DCF method aggregates these projected cash flows, discounts them at an appropriate rate, and arrives at an intrinsic value per share. For Maplebear, this calculated fair value stands at $106.37 per share. Compared to the current market price, this implies the shares trade at a 62.9% discount, which suggests significant undervaluation.
The takeaway, even with conservative assumptions and caution around long-term projections, is that Maplebear appears meaningfully undervalued according to the DCF model.
Result: UNDERVALUED
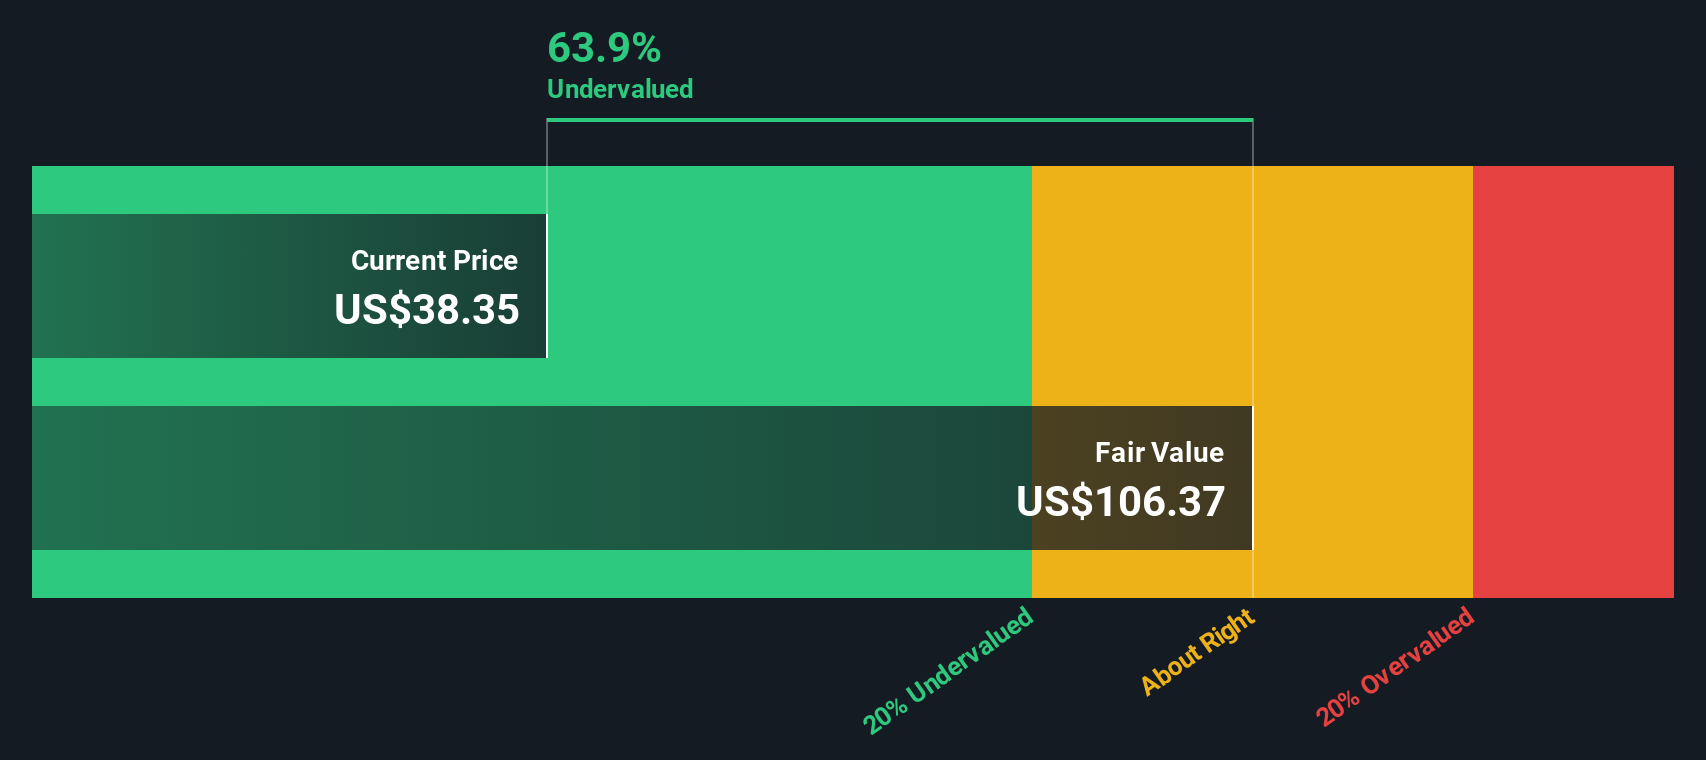
Our Discounted Cash Flow (DCF) analysis suggests Maplebear is undervalued by 62.9%. Track this in your watchlist or portfolio, or discover more undervalued stocks.
Approach 2: Maplebear Price vs Earnings (PE)
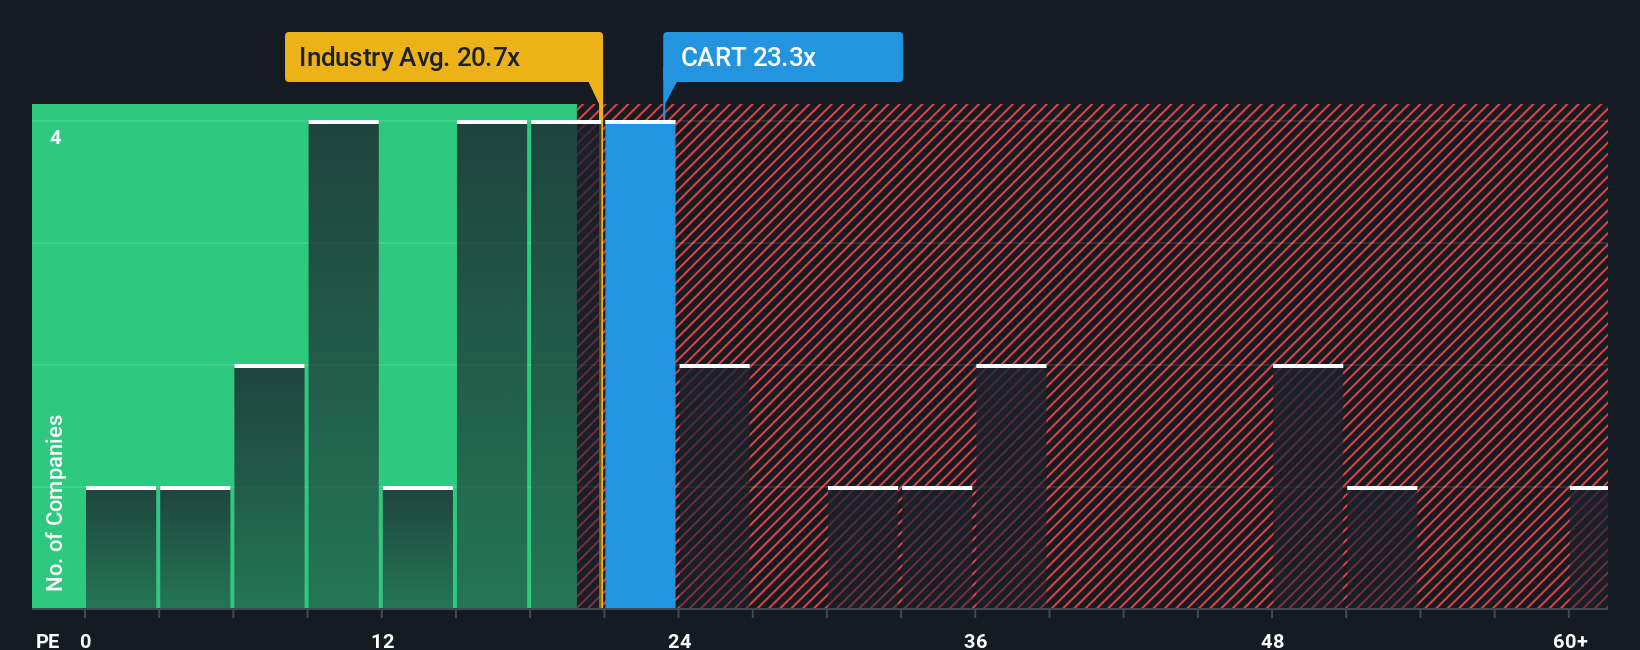
The Price-to-Earnings (PE) ratio is often the go-to valuation method for profitable companies like Maplebear, as it reflects how much investors are willing to pay today for one dollar of current earnings. This makes it a popular quick check for whether a stock might be trading at a premium or bargain compared to its profit-generating power.
What’s considered a “normal” or “fair” PE ratio depends on many factors, mainly a company’s expected earnings growth and the risks tied to achieving those results. Higher growth expectations generally justify a higher PE, while more uncertainty or risk lowers the fair value. For Maplebear, the current PE ratio stands at 21.7x. For perspective, the average PE across the Consumer Retailing industry is 21.3x and similar peers average 20.9x.
Simply Wall St’s proprietary “Fair Ratio” customizes this view by weighing Maplebear’s earnings growth, industry dynamics, profit margins, market cap, and risks all at once. This provides a more holistic benchmark than just comparing against industry or peer averages. For Maplebear, the Fair Ratio is pegged at 22.2x, which is close to its actual valuation. This suggests the market is pricing Maplebear’s earnings more or less in line with what you would expect given its specific strengths and risks.
Result: ABOUT RIGHT
PE ratios tell one story, but what if the real opportunity lies elsewhere? Discover companies where insiders are betting big on explosive growth.
Upgrade Your Decision Making: Choose your Maplebear Narrative
Earlier we mentioned that there's an even better way to understand valuation, so let's introduce you to Narratives. A Narrative is a simple, smart tool that lets you attach your personal view or story about Maplebear, explaining what you believe about its future revenue, earnings, margins, and fair value, to the actual numbers.
Instead of focusing solely on price ratios or forecasts, Narratives help you make decisions by bridging the company’s story, your own expectations, and dynamic financial data. Available right on Simply Wall St’s Community page, where millions of investors share insights, Narratives allow you to track, update, and compare your fair value to the current stock price with one click.
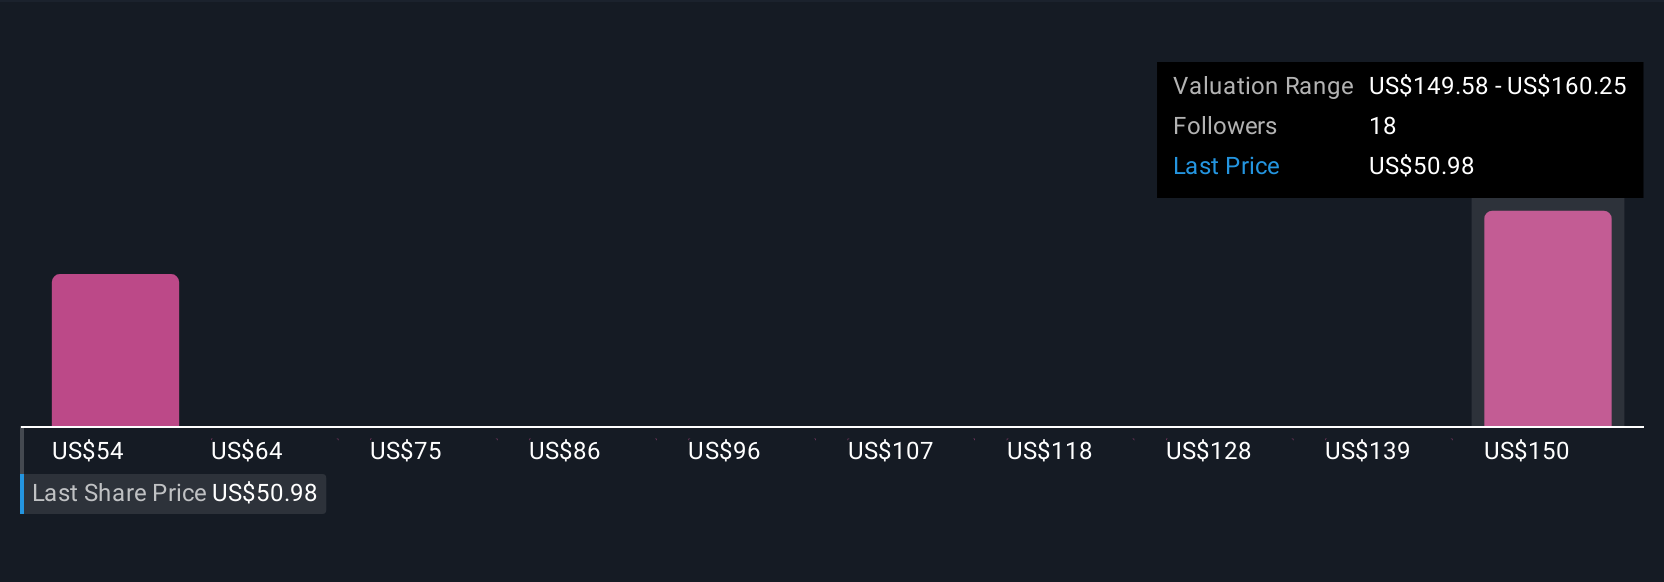
Each Narrative is automatically updated if fresh news or an earnings report changes the outlook, so your estimate always reflects the latest information. For example, one investor might predict Maplebear will outperform by capturing market share with new AI-powered grocery tech and set a bullish fair value of $67.00, while another may be more cautious about competition and assign a fair value closer to $42.00. Each Narrative reveals the reasoning behind these numbers.
This approach gives you clarity and confidence to buy or sell based not just on market movements, but on your own evolving assessment of Maplebear’s story and financial potential.
Do you think there's more to the story for Maplebear? Create your own Narrative to let the Community know!
This article by Simply Wall St is general in nature. We provide commentary based on historical data and analyst forecasts only using an unbiased methodology and our articles are not intended to be financial advice. It does not constitute a recommendation to buy or sell any stock, and does not take account of your objectives, or your financial situation. We aim to bring you long-term focused analysis driven by fundamental data. Note that our analysis may not factor in the latest price-sensitive company announcements or qualitative material. Simply Wall St has no position in any stocks mentioned.
The New Payments ETF Is Live on NASDAQ:
Money is moving to real-time rails, and a newly listed ETF now gives investors direct exposure. Fast settlement. Institutional custody. Simple access.
Explore how this launch could reshape portfolios
Sponsored ContentNew: Manage All Your Stock Portfolios in One Place
We've created the ultimate portfolio companion for stock investors, and it's free.
• Connect an unlimited number of Portfolios and see your total in one currency
• Be alerted to new Warning Signs or Risks via email or mobile
• Track the Fair Value of your stocks
Have feedback on this article? Concerned about the content? Get in touch with us directly. Alternatively, email editorial-team@simplywallst.com
About NasdaqGS:CART
Maplebear
Maplebear Inc., doing business as Instacart, engages in the provision of online grocery shopping services to households in North America.
Flawless balance sheet with solid track record.
Similar Companies
Market Insights

Weekly Picks

THE KINGDOM OF BROWN GOODS: WHY MGPI IS BEING CRUSHED BY INVENTORY & PRIMED FOR RESURRECTION


Why Vertical Aerospace (NYSE: EVTL) is Worth Possibly Over 13x its Current Price


The Quiet Giant That Became AI’s Power Grid
Recently Updated Narratives

Cheap if able to sustain revenue, and a potential bargain if able to turn store openings into revenue growth

Butler National (Buks) outperforms.


A tech powerhouse quietly powering the world’s AI infrastructure.
Popular Narratives


MicroVision will explode future revenue by 380.37% with a vision towards success


Crazy Undervalued 42 Baggers Silver Play (Active & Running Mine)


