Advertisement
- United States
- /
- Luxury
- /
- NYSE:UAA
Should You Be Tempted by Under Armour After a 43% Drop and Leadership Shakeup?

Simply Wall St
Reviewed by Bailey Pemberton
- Ever wondered if Under Armour stock is truly a bargain or just looks tempting at first glance? You're in the right place for a straight-talking breakdown of what the numbers and market sentiment really suggest about its value.
- The stock is down sharply this year, with a 43.1% decline year-to-date and a tough 47.3% drop over the past twelve months. This performance raises eyebrows about its future growth prospects or indicates a shift in the market’s risk appetite.
- Recent headlines around Under Armour focus on a strategic shift, including changes to executive leadership and renewed efforts to streamline the brand's global positioning. These moves have sparked both skepticism and optimism among investors, centering the conversation on whether the company can turn challenges into an opportunity.
- According to valuation checks, Under Armour currently scores just 2/6, suggesting more headwinds than hidden value. However, standard techniques might not tell the whole story. Read on as we break down the main valuation approaches and hint at a smarter way to gauge if Under Armour is actually priced right.
Under Armour scores just 2/6 on our valuation checks. See what other red flags we found in the full valuation breakdown.
Approach 1: Under Armour Discounted Cash Flow (DCF) Analysis
The Discounted Cash Flow (DCF) model estimates the true value of a company by projecting its expected future cash flows and discounting them back to the present using a required rate of return. This approach helps determine what Under Armour stock is fundamentally worth today, based on its capacity to generate cash in the years ahead.
For Under Armour, the latest reported Free Cash Flow (FCF) stands at a negative $310.7 million. Analyst estimates forecast an improving trend, projecting FCF to climb to $91 million by 2027 and $127.7 million by 2028, reaching approximately $75 million by 2030. After 2028, projections are extrapolated to provide a fuller picture through 2035, gradually reducing in optimism but suggesting positive cash flow potential.
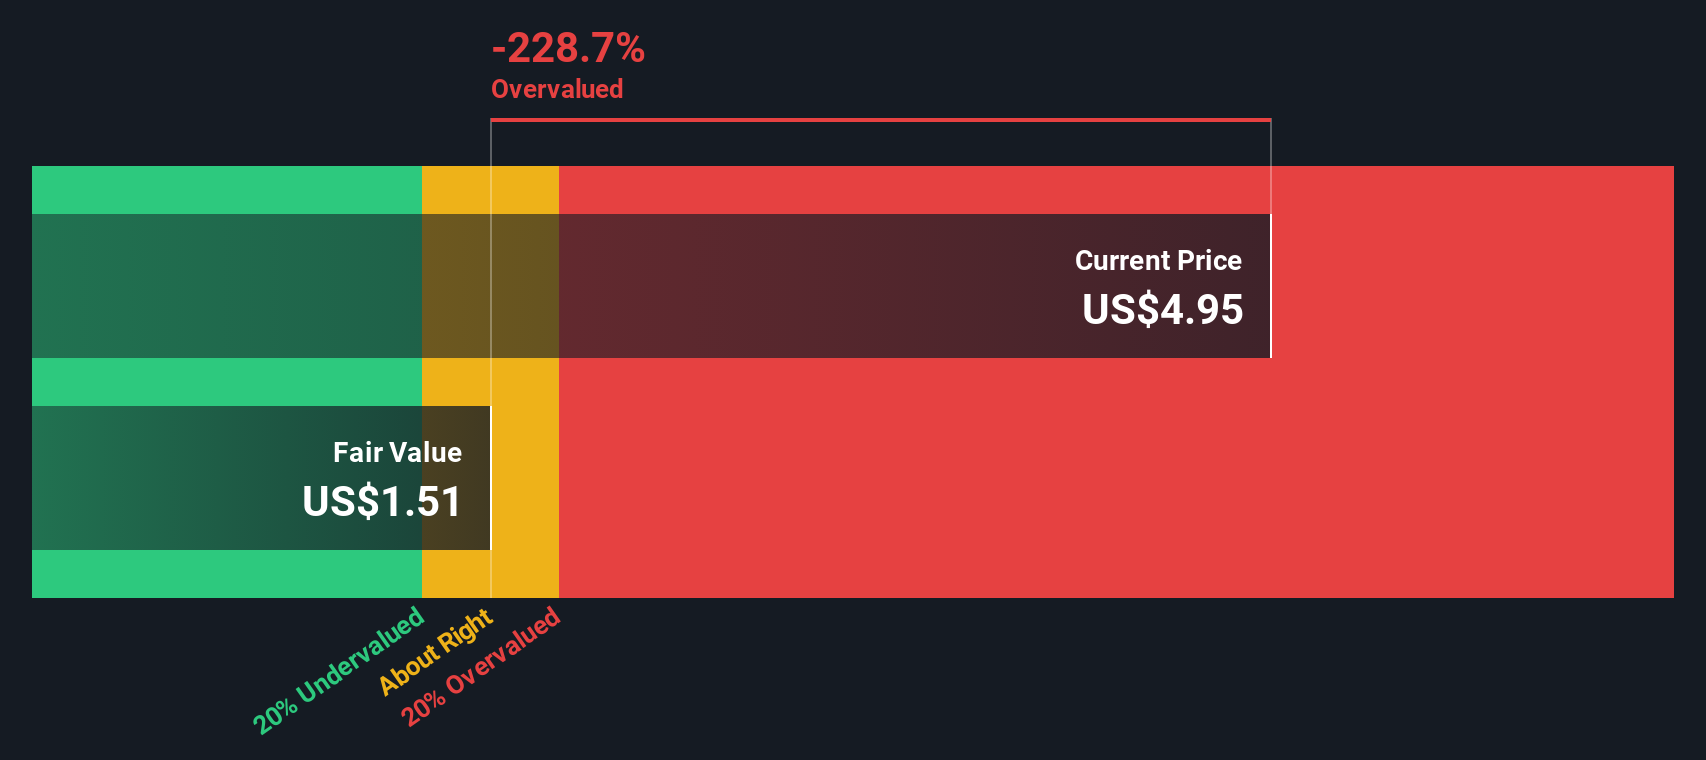
Applying the 2 Stage Free Cash Flow to Equity method, these projections are discounted to today's dollars. The result is an estimated intrinsic value per share of $1.48, as judged by this DCF approach.
When compared to the current market price, this intrinsic value implies that Under Armour stock is 210.9% overvalued. The gap between what the business generates in cash and what the market expects is significant at this point.
Result: OVERVALUED
Our Discounted Cash Flow (DCF) analysis suggests Under Armour may be overvalued by 210.9%. Discover 839 undervalued stocks or create your own screener to find better value opportunities.
Approach 2: Under Armour Price vs Earnings
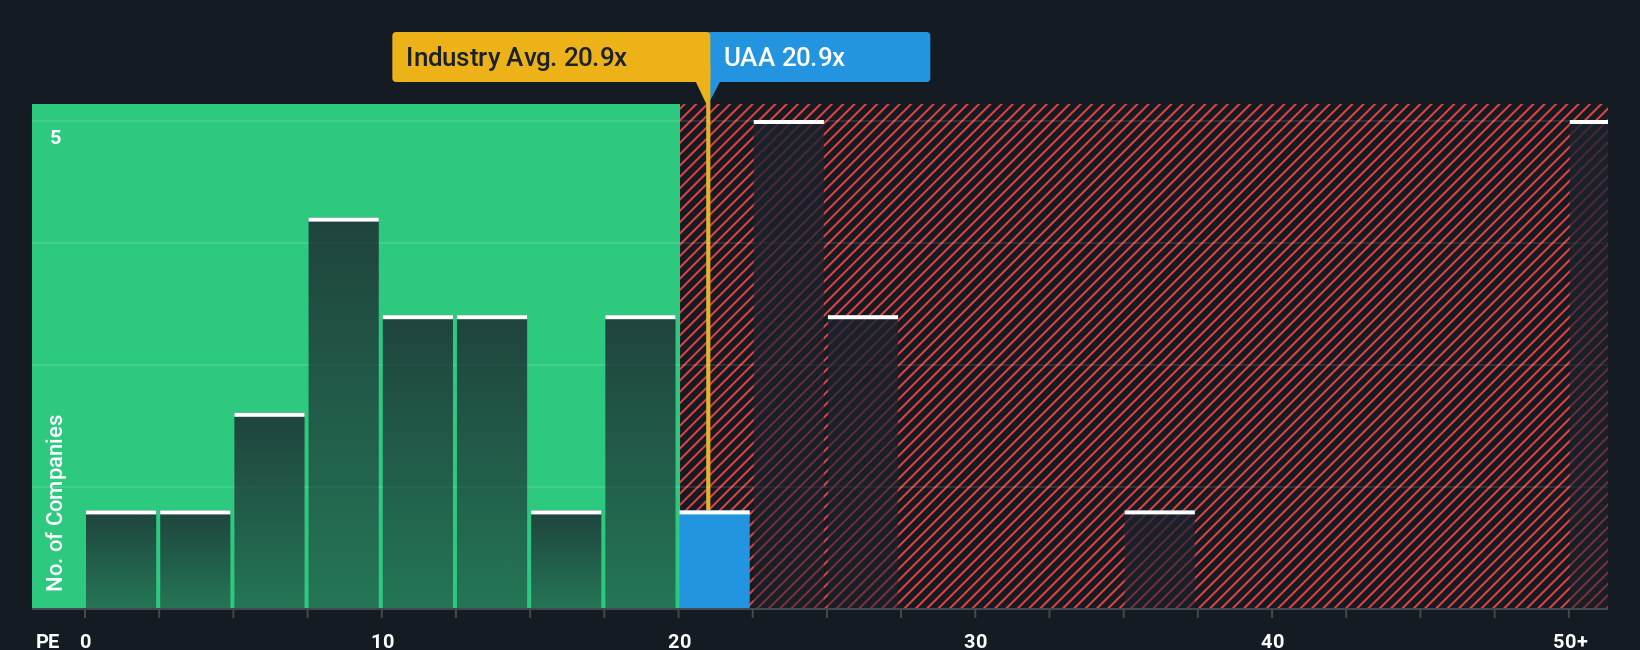
The price-to-earnings (PE) ratio is often the go-to metric for valuing profitable companies, as it quickly tells investors how much they're paying for each dollar of a company’s earnings. This makes it especially useful for comparing businesses within the same industry, since it lines up company value against tangible performance from past profits.
The “normal” or “fair” PE ratio isn’t one-size-fits-all, though. Higher growth expectations generally justify a steeper PE multiple, while increased risks or lower profit margins can weigh it down. In other words, investors are willing to pay more for earnings if they believe the company can consistently grow, but will pay less if risks are heightened.
Under Armour currently trades at a PE ratio of 19.47x. That puts it just under the Luxury industry average of 20.61x and above its peer group’s average of 12.27x. These comparisons suggest that investors are pricing Under Armour closer to what’s typical for its industry, but at a premium to direct competitors.
To get a more tailored perspective, Simply Wall St calculates a “Fair Ratio” of 21.78x for Under Armour. This is a proprietary benchmark that factors in growth, risk, profit margins, market cap and industry nuances, offering a more targeted assessment than simply relying on industry or peer averages.
Comparing the actual PE (19.47x) to this Fair Ratio (21.78x), Under Armour is trading at a slight discount to what its business characteristics warrant, though the difference is not dramatic.
Result: ABOUT RIGHT
PE ratios tell one story, but what if the real opportunity lies elsewhere? Discover 1404 companies where insiders are betting big on explosive growth.
Upgrade Your Decision Making: Choose your Under Armour Narrative
Earlier we mentioned that there is an even better way to understand valuation, so let us introduce you to Narratives. A Narrative is simply the story you believe about a company—your perspective on its future—turned into numbers like fair value, estimated revenue, profit, and margins, all tied together in a single, easy-to-use tool.
By connecting a company’s story to a financial forecast and then to a fair value, Narratives let you see your investment logic made tangible. It is not just about plugging numbers into a spreadsheet, but about translating your beliefs (or what you learn from the wider investor community) into a live, actionable price target. On Simply Wall St’s Community page, millions of everyday investors use Narratives to see how their view stacks up or to test how fair value changes with each new idea, earnings report, or piece of news.
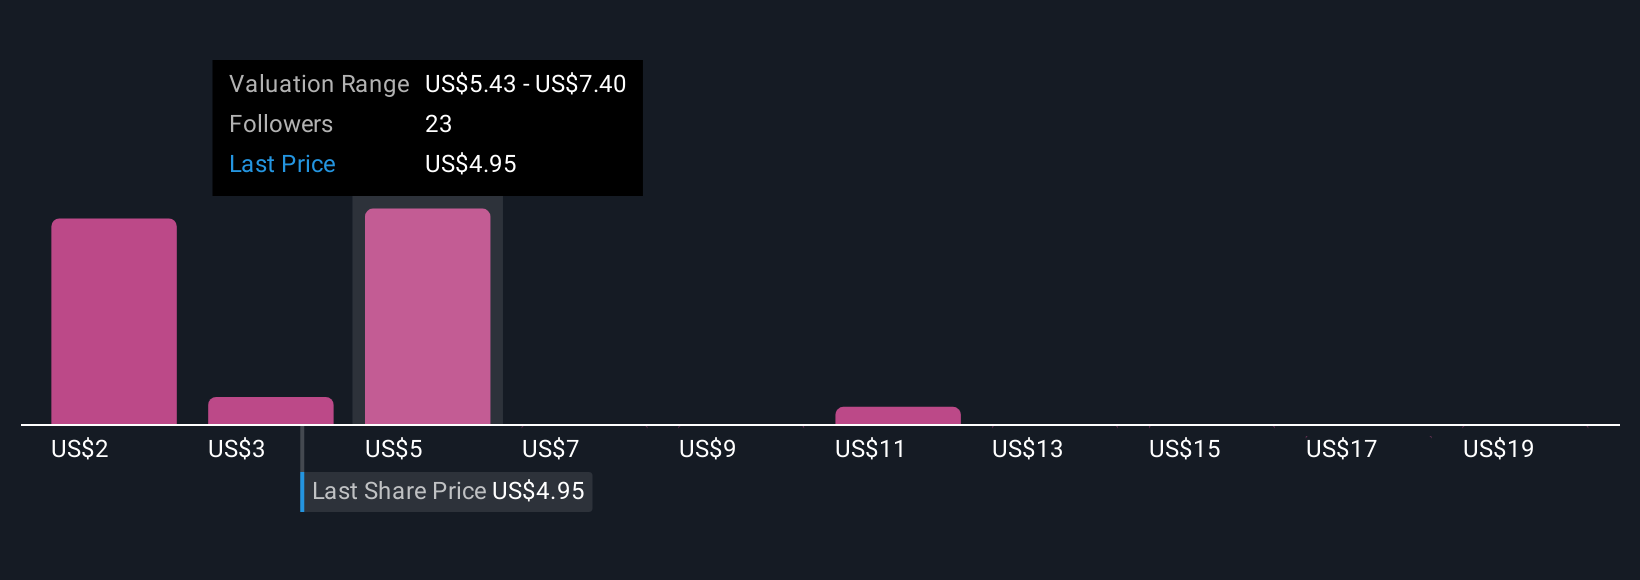
Narratives are dynamic, and they update as the facts change, so your investment decisions are always grounded in the latest information. For Under Armour, one investor might see a story of international brand expansion and assign a fair value of $13.80 per share, while another, worried about persistent margin pressures, values it at just $4.00. Which Narrative do you believe?
Do you think there's more to the story for Under Armour? Head over to our Community to see what others are saying!
This article by Simply Wall St is general in nature. We provide commentary based on historical data and analyst forecasts only using an unbiased methodology and our articles are not intended to be financial advice. It does not constitute a recommendation to buy or sell any stock, and does not take account of your objectives, or your financial situation. We aim to bring you long-term focused analysis driven by fundamental data. Note that our analysis may not factor in the latest price-sensitive company announcements or qualitative material. Simply Wall St has no position in any stocks mentioned.
New: AI Stock Screener & Alerts
Our new AI Stock Screener scans the market every day to uncover opportunities.
• Dividend Powerhouses (3%+ Yield)
• Undervalued Small Caps with Insider Buying
• High growth Tech and AI Companies
Or build your own from over 50 metrics.
Have feedback on this article? Concerned about the content? Get in touch with us directly. Alternatively, email editorial-team@simplywallst.com
About NYSE:UAA
Under Armour
Engages developing, marketing, and distributing performance apparel, footwear, and accessories for men, women, and youth.
Excellent balance sheet with moderate growth potential.
Similar Companies
Market Insights

Advertisement
Community Narratives
The company that turned a verb into a global necessity and basically runs the modern internet, digital ads, smartphones, maps, and AI.
Fair Value US$300.00|5.2% undervalued
OS
Community Contributor
Flowers Foods Pays A Fair Price For Health
Fair Value US$16.12|24.9% undervalued
NV
Community Contributor
TMX Group will thrive with 33.3% profit margin and enduring market moat
Fair Value CA$49.90|3.3% overvalued
LI
Community Contributor
The "Molecular Pencil": Why Beam's Technology is Built to Win
Fair Value US$65.01|64.5% undervalued
DA
Community Contributor