Stock Analysis
- United States
- /
- Leisure
- /
- NYSE:MPX
How Does Marine Products's (NYSE:MPX) P/E Compare To Its Industry, After The Share Price Drop?


Unfortunately for some shareholders, the Marine Products (NYSE:MPX) share price has dived 37% in the last thirty days. That drop has capped off a tough year for shareholders, with the share price down 37% in that time.
All else being equal, a share price drop should make a stock more attractive to potential investors. In the long term, share prices tend to follow earnings per share, but in the short term prices bounce around in response to short term factors (which are not always obvious). So, on certain occasions, long term focussed investors try to take advantage of pessimistic expectations to buy shares at a better price. Perhaps the simplest way to get a read on investors' expectations of a business is to look at its Price to Earnings Ratio (PE Ratio). Investors have optimistic expectations of companies with higher P/E ratios, compared to companies with lower P/E ratios.
See our latest analysis for Marine Products
How Does Marine Products's P/E Ratio Compare To Its Peers?
Marine Products's P/E of 10.24 indicates relatively low sentiment towards the stock. If you look at the image below, you can see Marine Products has a lower P/E than the average (12.9) in the leisure industry classification.
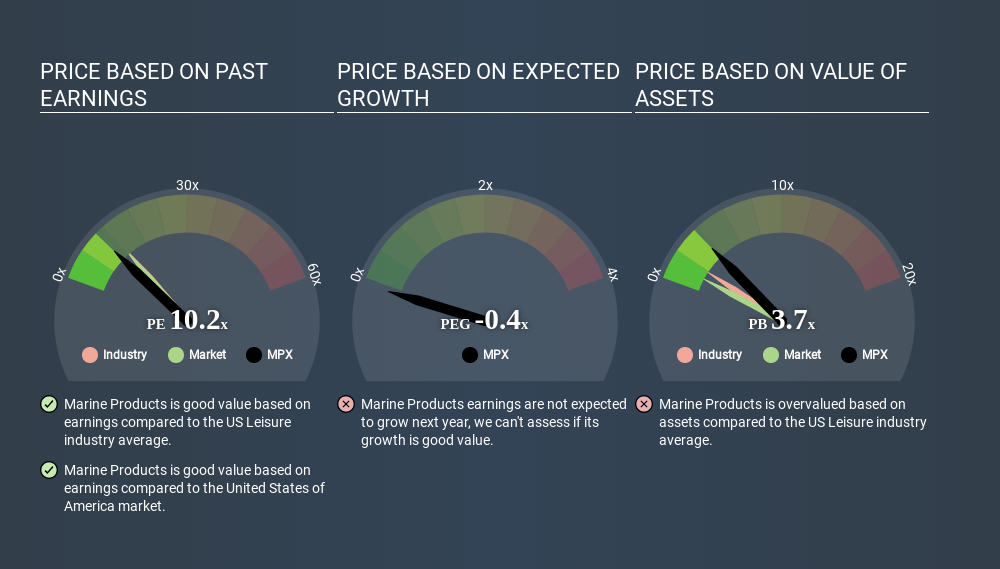
Marine Products's P/E tells us that market participants think it will not fare as well as its peers in the same industry. While current expectations are low, the stock could be undervalued if the situation is better than the market assumes. You should delve deeper. I like to check if company insiders have been buying or selling.
How Growth Rates Impact P/E Ratios
P/E ratios primarily reflect market expectations around earnings growth rates. When earnings grow, the 'E' increases, over time. Therefore, even if you pay a high multiple of earnings now, that multiple will become lower in the future. So while a stock may look expensive based on past earnings, it could be cheap based on future earnings.
Marine Products had pretty flat EPS growth in the last year. But it has grown its earnings per share by 28% per year over the last five years.
Remember: P/E Ratios Don't Consider The Balance Sheet
The 'Price' in P/E reflects the market capitalization of the company. That means it doesn't take debt or cash into account. The exact same company would hypothetically deserve a higher P/E ratio if it had a strong balance sheet, than if it had a weak one with lots of debt, because a cashed up company can spend on growth.
Such spending might be good or bad, overall, but the key point here is that you need to look at debt to understand the P/E ratio in context.
Marine Products's Balance Sheet
The extra options and safety that comes with Marine Products's US$20m net cash position means that it deserves a higher P/E than it would if it had a lot of net debt.
The Verdict On Marine Products's P/E Ratio
Marine Products has a P/E of 10.2. That's below the average in the US market, which is 12.6. Earnings improved over the last year. And the net cash position gives the company many options. So it's strange that the low P/E indicates low expectations. Given Marine Products's P/E ratio has declined from 16.4 to 10.2 in the last month, we know for sure that the market is significantly less confident about the business today, than it was back then. For those who prefer to invest with the flow of momentum, that might be a bad sign, but for a contrarian, it may signal opportunity.
When the market is wrong about a stock, it gives savvy investors an opportunity. If the reality for a company is not as bad as the P/E ratio indicates, then the share price should increase as the market realizes this. So this free visual report on analyst forecasts could hold the key to an excellent investment decision.
Of course, you might find a fantastic investment by looking at a few good candidates. So take a peek at this free list of companies with modest (or no) debt, trading on a P/E below 20.
If you spot an error that warrants correction, please contact the editor at editorial-team@simplywallst.com. This article by Simply Wall St is general in nature. It does not constitute a recommendation to buy or sell any stock, and does not take account of your objectives, or your financial situation. Simply Wall St has no position in the stocks mentioned.
We aim to bring you long-term focused research analysis driven by fundamental data. Note that our analysis may not factor in the latest price-sensitive company announcements or qualitative material. Thank you for reading.
About NYSE:MPX
Marine Products
Designs, manufactures, and sells recreational fiberglass powerboats for the sport boat and sport fishing boat markets worldwide.
Flawless balance sheet established dividend payer.
