Advertisement
- United States
- /
- Consumer Durables
- /
- NYSE:DFH
Dream Finders Homes (DFH): Evaluating Valuation After Recent Share Price Decline

Simply Wall St
Reviewed by Simply Wall St
Dream Finders Homes (DFH) stock has been under pressure lately, giving up over 27% in the past month and about 41% over the last year. These declines raise questions regarding what is driving such persistent weakness.
See our latest analysis for Dream Finders Homes.
Dream Finders Homes’ rough patch has been hard to miss, with momentum clearly fading as the share price return over the past year slumped to -41.14%. Despite periods of growth in the past, this latest pullback comes as investor sentiment shifts amid softening results and renewed caution on housing market risks.
If you’re weighing what else is out there, this could be a smart moment to broaden your horizons and discover fast growing stocks with high insider ownership
With shares now trading at a sizeable discount to analyst targets and recent profits under pressure, the question becomes whether the market is overlooking value or if future challenges are already fully reflected in the price.
Price-to-Earnings of 6.5x: Is it justified?
Dream Finders Homes is trading at a price-to-earnings (P/E) ratio of just 6.5x, noticeably below both the overall US market and industry benchmark levels. At the last close of $19.07, this low multiple suggests that investors may be discounting the company’s future earnings power compared to peers.
The price-to-earnings ratio is a key gauge of how much investors are willing to pay for each dollar of company profit. For homebuilders, this figure helps signal the market’s view on earnings quality and growth potential amid sector volatility.
DFH’s P/E is meaningfully lower than the Consumer Durables industry average of 10.4x and also below the peer set’s average of 8x. Importantly, regression analysis points to a “fair” P/E ratio of 10.7x for DFH, indicating potential room for upward re-rating if results stabilize and sentiment improves. This wide gap to the fair ratio sets the stage for significant price movement should investor perceptions shift.
Explore the SWS fair ratio for Dream Finders Homes
Result: Price-to-Earnings of 6.5x (UNDERVALUED)
However, recent annual declines in revenue and net income growth highlight that further softness or a missed recovery could weigh on sentiment and future pricing.
Find out about the key risks to this Dream Finders Homes narrative.
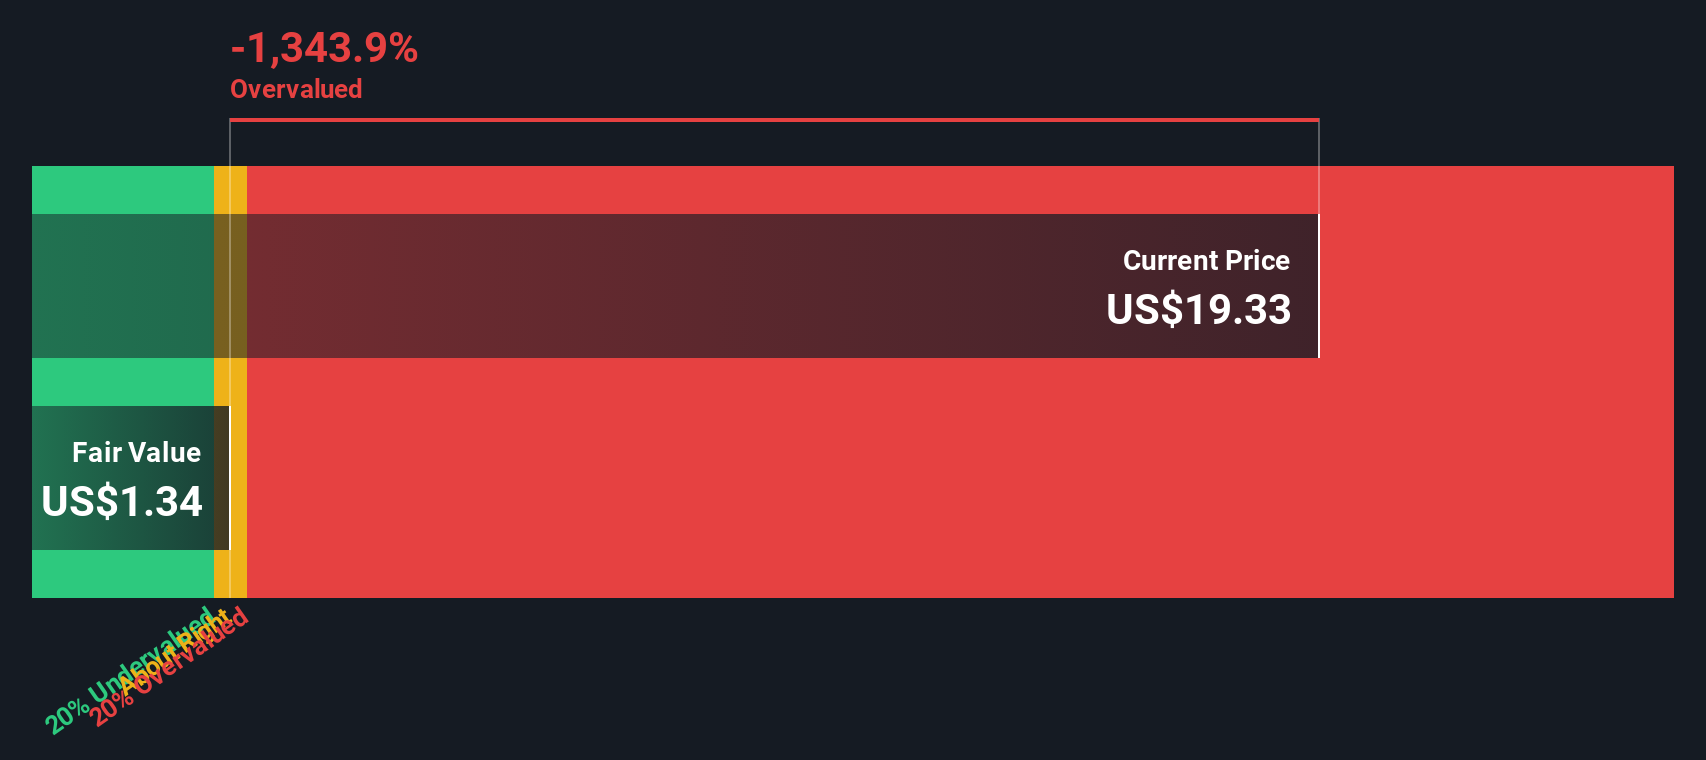
Another View: Discounted Cash Flow Paints a Different Picture
While the price-to-earnings ratio makes Dream Finders Homes look undervalued, our SWS DCF model presents a sharp contrast. According to this approach, the current share price of $19.07 actually sits well above the estimated fair value of $1.34. This suggests the stock may be overvalued if we rely on future cash flow projections. Which method should investors trust when outlooks differ so greatly?
Look into how the SWS DCF model arrives at its fair value.
Simply Wall St performs a discounted cash flow (DCF) on every stock in the world every day (check out Dream Finders Homes for example). We show the entire calculation in full. You can track the result in your watchlist or portfolio and be alerted when this changes, or use our stock screener to discover 840 undervalued stocks based on their cash flows. If you save a screener we even alert you when new companies match - so you never miss a potential opportunity.
Build Your Own Dream Finders Homes Narrative
If you think there’s more to the story or want to put the numbers to the test yourself, you can shape your own analysis in just a few minutes. Do it your way
A great starting point for your Dream Finders Homes research is our analysis highlighting 2 key rewards and 3 important warning signs that could impact your investment decision.
Looking for more investment ideas?
Seize this opportunity to put your money to work by uncovering stocks with serious upside to help your portfolio stay ahead of the curve.
- Tap into high-potential companies shaking up the digital asset landscape with these 82 cryptocurrency and blockchain stocks before they make major headlines.
- Secure reliable income streams and amplify your long-term gains by exploring these 20 dividend stocks with yields > 3% with strong yields above 3%.
- Capitalize on the next wave of artificial intelligence growth and unlock fresh opportunities now inside these 26 AI penny stocks.
This article by Simply Wall St is general in nature. We provide commentary based on historical data and analyst forecasts only using an unbiased methodology and our articles are not intended to be financial advice. It does not constitute a recommendation to buy or sell any stock, and does not take account of your objectives, or your financial situation. We aim to bring you long-term focused analysis driven by fundamental data. Note that our analysis may not factor in the latest price-sensitive company announcements or qualitative material. Simply Wall St has no position in any stocks mentioned.
New: Manage All Your Stock Portfolios in One Place
We've created the ultimate portfolio companion for stock investors, and it's free.
• Connect an unlimited number of Portfolios and see your total in one currency
• Be alerted to new Warning Signs or Risks via email or mobile
• Track the Fair Value of your stocks
Have feedback on this article? Concerned about the content? Get in touch with us directly. Alternatively, email editorial-team@simplywallst.com
About NYSE:DFH
Dream Finders Homes
Through its subsidiary, Dream Finders Homes LLC, engages in the homebuilding business in the United States.
Fair value with mediocre balance sheet.
Similar Companies
Market Insights

Advertisement
Community Narratives
The company that turned a verb into a global necessity and basically runs the modern internet, digital ads, smartphones, maps, and AI.
Fair Value US$300.00|7.5% undervalued
OS
Community Contributor
Flowers Foods Pays A Fair Price For Health
Fair Value US$16.12|25.4% undervalued
NV
Community Contributor
TMX Group will thrive with 33.3% profit margin and enduring market moat
Fair Value CA$49.90|3.6% overvalued
LI
Community Contributor
The "Molecular Pencil": Why Beam's Technology is Built to Win
Fair Value US$65.01|65.0% undervalued
DA
Community Contributor