- United States
- /
- Luxury
- /
- NasdaqGM:PLBY
PLBY Group, Inc.'s (NASDAQ:PLBY) 34% Dip Still Leaving Some Shareholders Feeling Restless Over Its P/SRatio

PLBY Group, Inc. (NASDAQ:PLBY) shares have retraced a considerable 34% in the last month, reversing a fair amount of their solid recent performance. The recent drop completes a disastrous twelve months for shareholders, who are sitting on a 61% loss during that time.
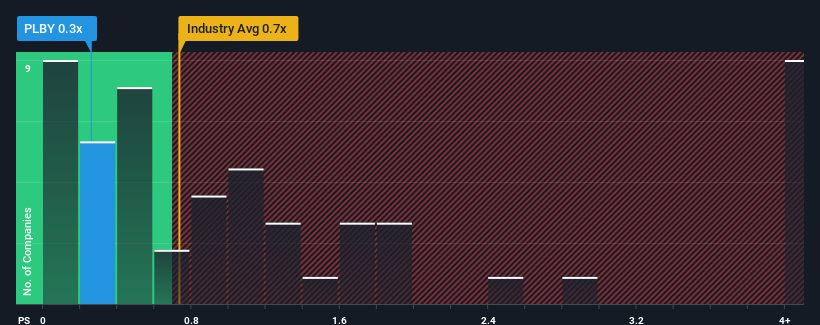
Even after such a large drop in price, it's still not a stretch to say that PLBY Group's price-to-sales (or "P/S") ratio of 0.3x right now seems quite "middle-of-the-road" compared to the Luxury industry in the United States, where the median P/S ratio is around 0.7x. However, investors might be overlooking a clear opportunity or potential setback if there is no rational basis for the P/S.
See our latest analysis for PLBY Group

How Has PLBY Group Performed Recently?
While the industry has experienced revenue growth lately, PLBY Group's revenue has gone into reverse gear, which is not great. It might be that many expect the dour revenue performance to strengthen positively, which has kept the P/S from falling. If not, then existing shareholders may be a little nervous about the viability of the share price.
If you'd like to see what analysts are forecasting going forward, you should check out our free report on PLBY Group.Is There Some Revenue Growth Forecasted For PLBY Group?
In order to justify its P/S ratio, PLBY Group would need to produce growth that's similar to the industry.
Taking a look back first, the company's revenue growth last year wasn't something to get excited about as it posted a disappointing decline of 2.7%. Still, the latest three year period has seen an excellent 88% overall rise in revenue, in spite of its unsatisfying short-term performance. Although it's been a bumpy ride, it's still fair to say the revenue growth recently has been more than adequate for the company.
Shifting to the future, estimates from the two analysts covering the company suggest revenue growth is heading into negative territory, declining 18% per year over the next three years. That's not great when the rest of the industry is expected to grow by 7.1% per year.
In light of this, it's somewhat alarming that PLBY Group's P/S sits in line with the majority of other companies. Apparently many investors in the company reject the analyst cohort's pessimism and aren't willing to let go of their stock right now. There's a good chance these shareholders are setting themselves up for future disappointment if the P/S falls to levels more in line with the negative growth outlook.
What We Can Learn From PLBY Group's P/S?
Following PLBY Group's share price tumble, its P/S is just clinging on to the industry median P/S. Generally, our preference is to limit the use of the price-to-sales ratio to establishing what the market thinks about the overall health of a company.
While PLBY Group's P/S isn't anything out of the ordinary for companies in the industry, we didn't expect it given forecasts of revenue decline. When we see a gloomy outlook like this, our immediate thoughts are that the share price is at risk of declining, negatively impacting P/S. If the declining revenues were to materialize in the form of a declining share price, shareholders will be feeling the pinch.
Before you take the next step, you should know about the 5 warning signs for PLBY Group (1 is significant!) that we have uncovered.
Of course, profitable companies with a history of great earnings growth are generally safer bets. So you may wish to see this free collection of other companies that have reasonable P/E ratios and have grown earnings strongly.
New: Manage All Your Stock Portfolios in One Place
We've created the ultimate portfolio companion for stock investors, and it's free.
• Connect an unlimited number of Portfolios and see your total in one currency
• Be alerted to new Warning Signs or Risks via email or mobile
• Track the Fair Value of your stocks
Have feedback on this article? Concerned about the content? Get in touch with us directly. Alternatively, email editorial-team (at) simplywallst.com.
This article by Simply Wall St is general in nature. We provide commentary based on historical data and analyst forecasts only using an unbiased methodology and our articles are not intended to be financial advice. It does not constitute a recommendation to buy or sell any stock, and does not take account of your objectives, or your financial situation. We aim to bring you long-term focused analysis driven by fundamental data. Note that our analysis may not factor in the latest price-sensitive company announcements or qualitative material. Simply Wall St has no position in any stocks mentioned.
About NasdaqGM:PLBY
Playboy
PLBY Group, Inc. operates as a pleasure and leisure company in the United States, Australia, China, the United Kingdom, and internationally.
Slight and overvalued.
Similar Companies
Market Insights
Community Narratives


