- United States
- /
- Luxury
- /
- NasdaqGS:LULU
Is Lululemon Attractive After a 45% Slide and Recent Rebound in 2025?

Reviewed by Bailey Pemberton
- If you are wondering whether lululemon athletica is a bargain or a value trap at today’s price, you are not alone. This breakdown is designed to give you a clear, no nonsense view.
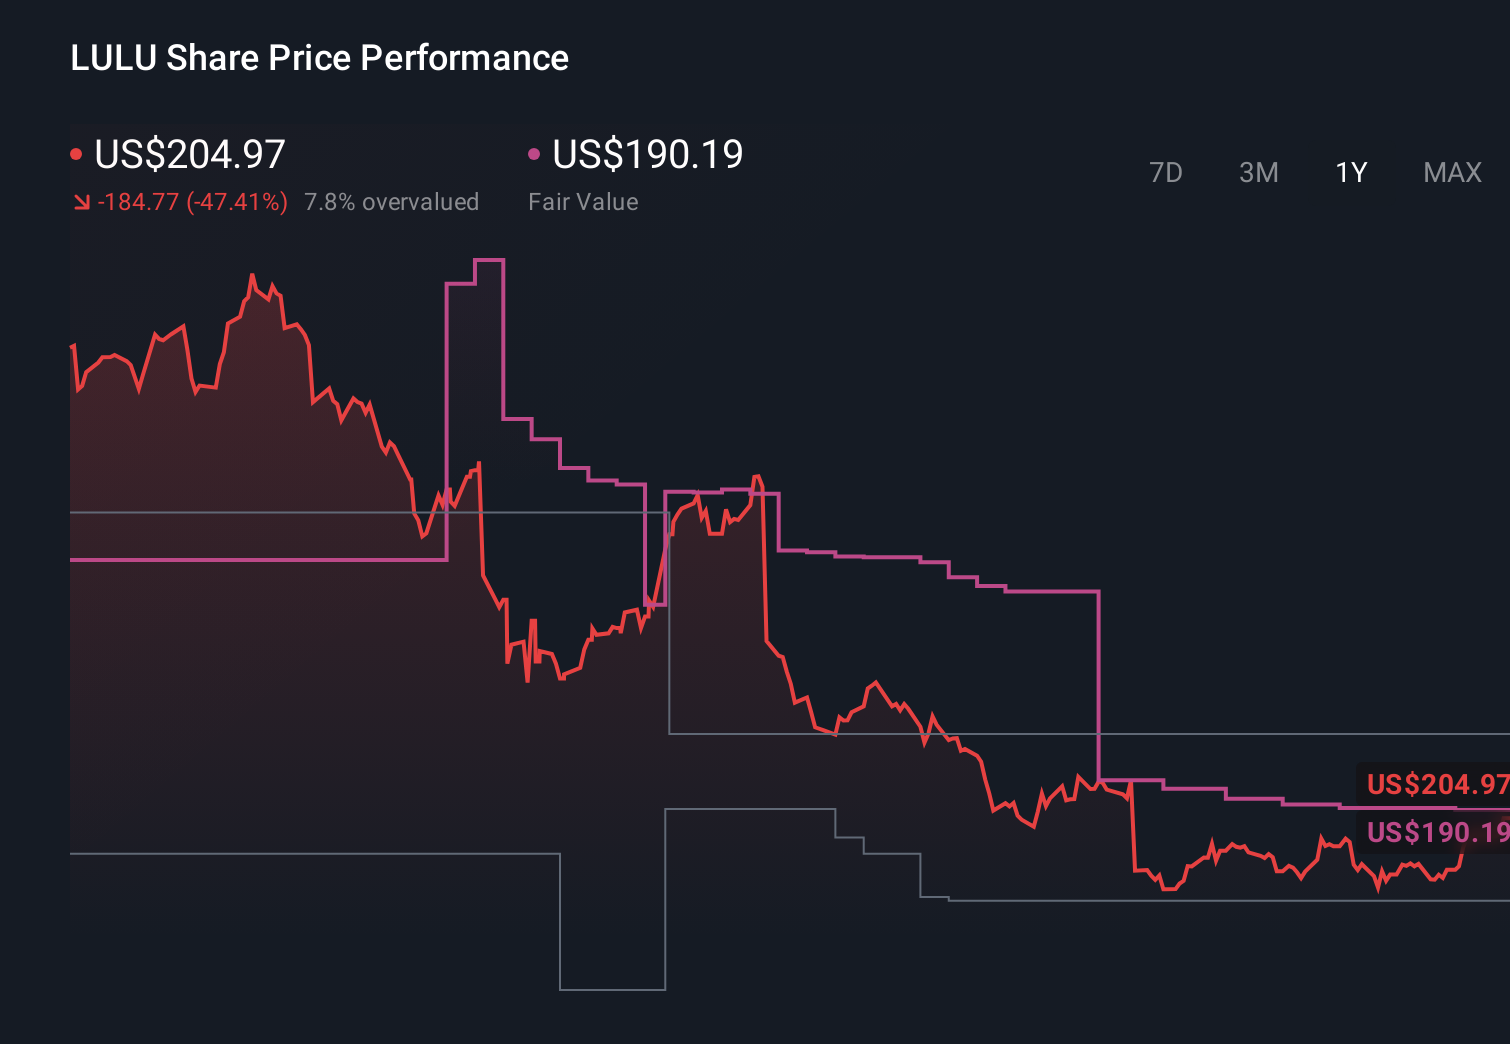
- The stock has bounced about 2.2% over the last week and 26.1% over the past month, but that comes after a bruising slide of around 43.7% year to date and 44.8% over the last year.
- Investors have been reacting to shifting sentiment around premium consumer spending and the broader sell off in high multiple growth names, which has brought athletic apparel brands into focus. At the same time, headlines around competition from both legacy sportswear giants and newer, digitally native brands have sharpened questions about how much growth lululemon can realistically sustain.
- Against that backdrop, lululemon scores a 4/6 valuation check score, suggesting it looks undervalued on several metrics but not across the board. Next, we will unpack what different valuation approaches say about the stock, and then finish with a more holistic way to think about its true worth.
Find out why lululemon athletica's -44.8% return over the last year is lagging behind its peers.
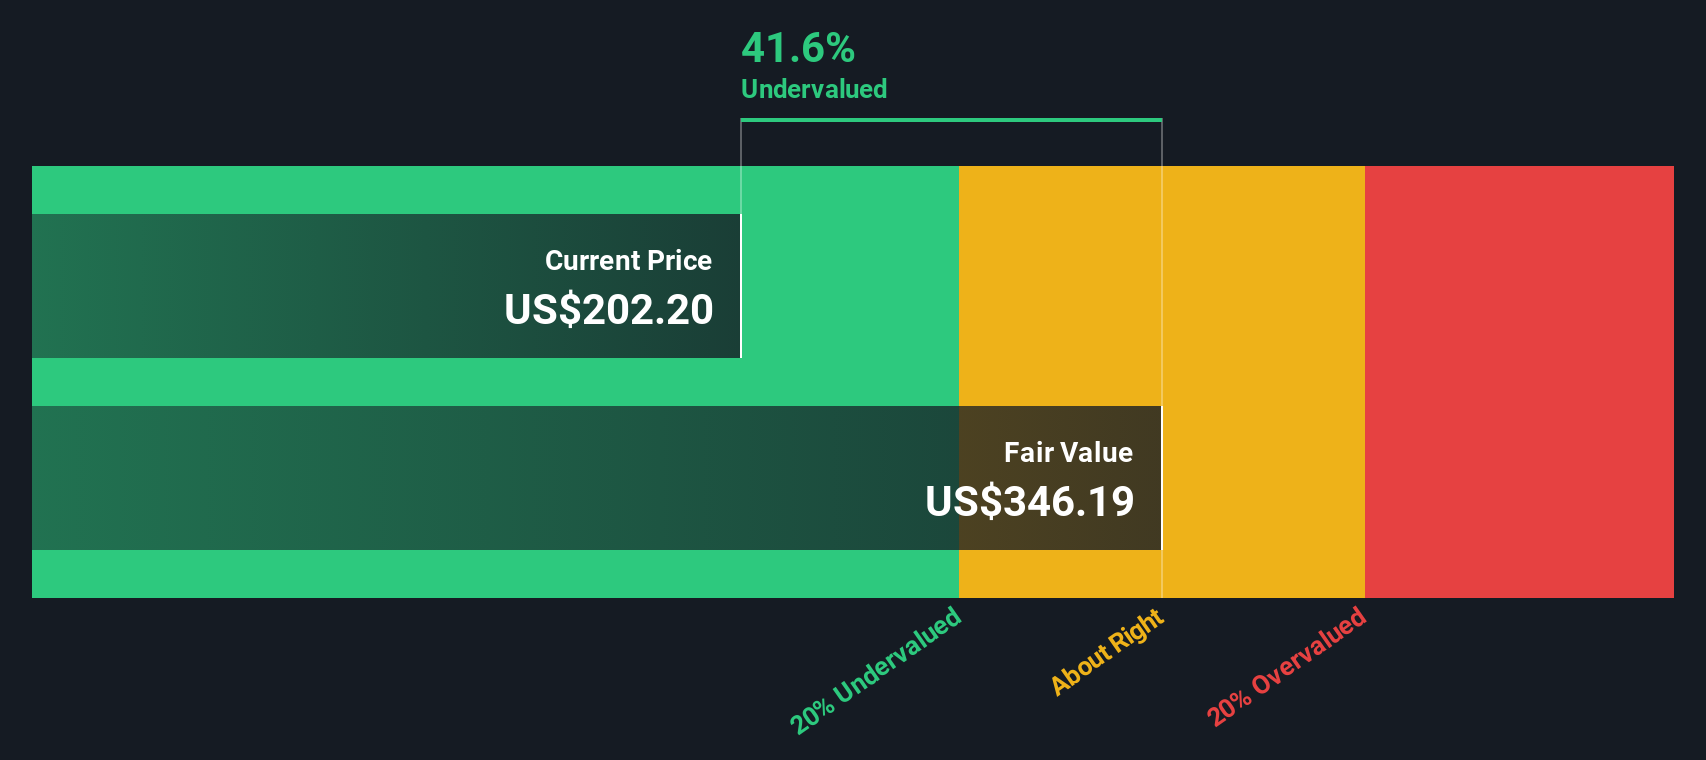
Approach 1: lululemon athletica Discounted Cash Flow (DCF) Analysis
A Discounted Cash Flow, or DCF, model estimates what a company is worth by projecting the cash it can generate in the future and then discounting those cash flows back to today in $ terms.
For lululemon athletica, the model used is a 2 Stage Free Cash Flow to Equity approach. The company generated around $1.12 billion in free cash flow over the last twelve months, and analyst forecasts, combined with Simply Wall St extrapolations, see free cash flow rising steadily toward roughly $2.12 billion by 2035. These projections assume stronger near term growth that gradually tapers off as the business matures.
When all those expected cash flows are discounted back to today, the DCF model puts lululemon’s intrinsic value at about $256.01 per share. Compared to the current market price, this implies the stock is roughly 18.2% undervalued, indicating that the market may be pricing in a more cautious future than the cash flow profile currently implies.
Result: UNDERVALUED
Our Discounted Cash Flow (DCF) analysis suggests lululemon athletica is undervalued by 18.2%. Track this in your watchlist or portfolio, or discover 914 more undervalued stocks based on cash flows.
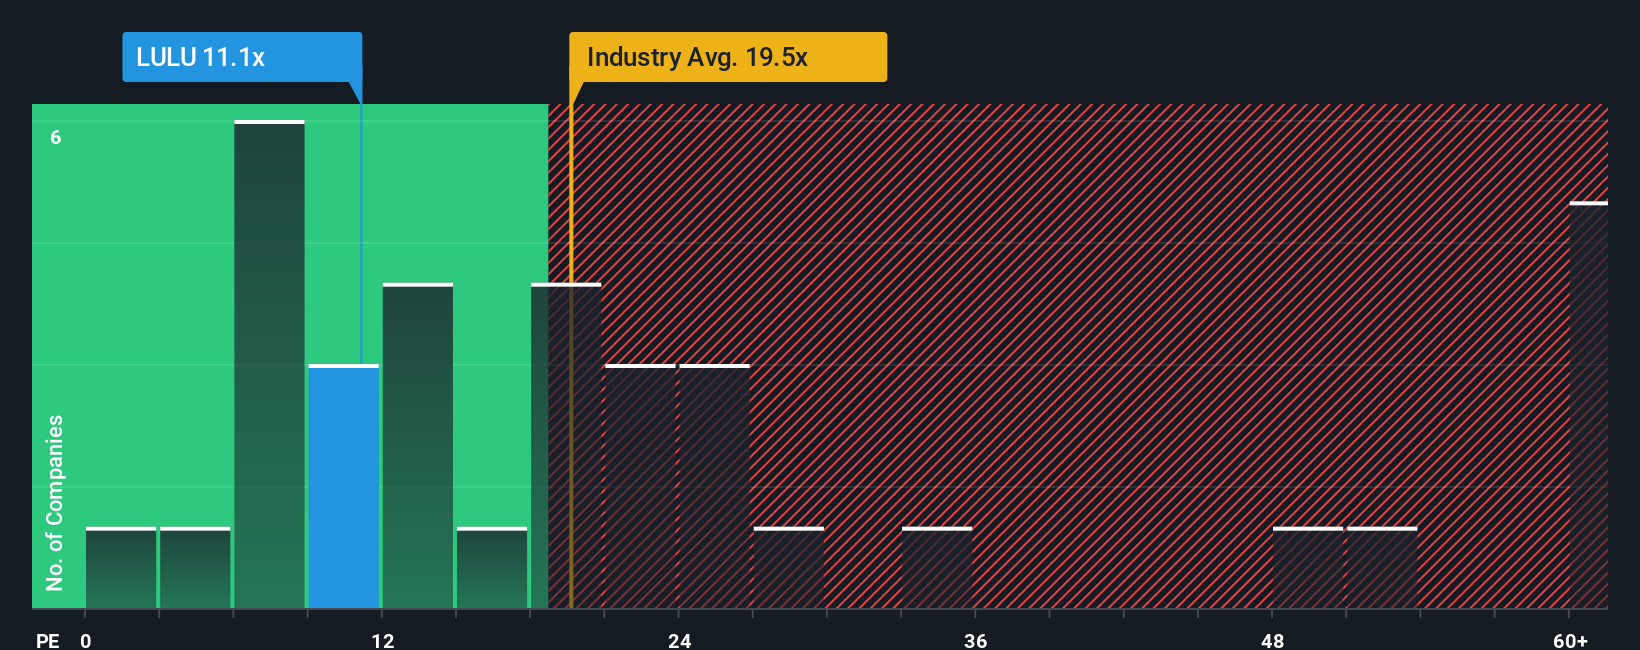
Approach 2: lululemon athletica Price vs Earnings
For a consistently profitable business like lululemon athletica, the price to earnings (PE) ratio is a practical way to gauge how much investors are paying for each dollar of current profits. In general, higher growth and lower perceived risk justify a higher PE, while slower growth or elevated uncertainty usually mean a lower, more conservative multiple is appropriate.
lululemon currently trades on a PE of about 14.1x, which is well below both the broader Luxury industry average of roughly 20.2x and the peer group average near 51.2x. On the surface, that discount suggests the market is baking in more caution about its future than for many comparable names.
Simply Wall St’s Fair Ratio framework refines this view by estimating what PE multiple would be reasonable given lululemon’s specific earnings growth prospects, profitability, industry, market cap and risk profile. This proprietary Fair Ratio comes out at about 17.5x and offers a more tailored benchmark than blunt peer or sector comparisons. Because this Fair Ratio sits meaningfully above the current 14.1x, it points to the shares trading at a discount to what would be expected given the fundamentals.
Result: UNDERVALUED
PE ratios tell one story, but what if the real opportunity lies elsewhere? Discover 1465 companies where insiders are betting big on explosive growth.
Upgrade Your Decision Making: Choose your lululemon athletica Narrative
Earlier we mentioned that there is an even better way to understand valuation. Let us introduce you to Narratives, a simple tool on Simply Wall St’s Community page that lets you tell the story behind your numbers by linking your view of lululemon’s business to a set of revenue, earnings and margin forecasts. These then roll into a Fair Value you can easily compare to today’s share price to decide whether to buy, hold or sell. That Fair Value will automatically update as new news or earnings arrive. For example, one investor might build a bullish lululemon narrative with faster revenue growth, stronger margins and a Fair Value closer to $226, while another takes a more cautious stance with slower growth, softer margins and a Fair Value nearer $190. Narratives makes it effortless to see how those two stories, and the decisions that follow, differ.
For lululemon athletica however we'll make it really easy for you with previews of two leading lululemon athletica Narratives:
🐂 lululemon athletica Bull Case
Fair Value: $225.76
Implied Undervaluation vs last close: -6.7%
Revenue Growth Assumption: 10%
- Views the recent share price as attractive relative to analyst consensus, with upside supported by a Moderate Buy rating and insider buying from the CEO.
- Emphasizes lululemon’s resilient market position in premium athleisure, supported by innovative products and effective management execution.
- Argues that strong financial performance, expansion initiatives and sustainability efforts together underpin a longer term growth story.
🐻 lululemon athletica Bear Case
Fair Value: $190.19
Implied Overvaluation vs last close: 10.1%
Revenue Growth Assumption: 4.92%
- Balances product innovation and international expansion benefits against softer U.S. trends, maturing brand power and rising competitive pressure.
- Highlights margin risks from tariffs, macro headwinds and potential need for greater discounting if new product cycles and casual assortments do not gain traction.
- Frames leadership turnover and strategic drift as execution risks that justify a more cautious fair value and lower growth and margin expectations.
Do you think there's more to the story for lululemon athletica? Head over to our Community to see what others are saying!
This article by Simply Wall St is general in nature. We provide commentary based on historical data and analyst forecasts only using an unbiased methodology and our articles are not intended to be financial advice. It does not constitute a recommendation to buy or sell any stock, and does not take account of your objectives, or your financial situation. We aim to bring you long-term focused analysis driven by fundamental data. Note that our analysis may not factor in the latest price-sensitive company announcements or qualitative material. Simply Wall St has no position in any stocks mentioned.
The New Payments ETF Is Live on NASDAQ:
Money is moving to real-time rails, and a newly listed ETF now gives investors direct exposure. Fast settlement. Institutional custody. Simple access.
Explore how this launch could reshape portfolios
Sponsored ContentValuation is complex, but we're here to simplify it.
Discover if lululemon athletica might be undervalued or overvalued with our detailed analysis, featuring fair value estimates, potential risks, dividends, insider trades, and its financial condition.
Access Free AnalysisHave feedback on this article? Concerned about the content? Get in touch with us directly. Alternatively, email editorial-team@simplywallst.com
About NasdaqGS:LULU
lululemon athletica
Designs, distributes, and retails technical athletic apparel, footwear, and accessories for women and men under the lululemon brand in the United States, Canada, Mexico, China Mainland, Hong Kong, Taiwan, Macau, and internationally.
Flawless balance sheet and good value.
Similar Companies
Market Insights


Weekly Picks

Early mover in a fast growing industry. Likely to experience share price volatility as they scale


A case for CA$31.80 (undiluted), aka 8,616% upside from CA$0.37 (an 86 bagger!).


Moderation and Stabilisation: HOLD: Fair Price based on a 4-year Cycle is $12.08
Recently Updated Narratives

Airbnb Stock: Platform Growth in a World of Saturation and Scrutiny

Clarivate Stock: When Data Becomes the Backbone of Innovation and Law

Adobe Stock: AI-Fueled ARR Growth Pushes Guidance Higher, But Cost Pressures Loom
Popular Narratives


Crazy Undervalued 42 Baggers Silver Play (Active & Running Mine)


NVDA: Expanding AI Demand Will Drive Major Data Center Investments Through 2026


MicroVision will explode future revenue by 380.37% with a vision towards success
Trending Discussion
