Advertisement
- United States
- /
- Luxury
- /
- NasdaqGS:LULU
Does Lululemon’s 6.4% Rally Signal a Shift After Months of Weakness?

Simply Wall St
Reviewed by Bailey Pemberton
Thinking about what to do with lululemon athletica stock right now? You're not alone. Investors have been watching closely as the price action gets harder to ignore. In just the past week, shares have bounced back by 6.4%, but that follows a much tougher stretch. Over the last year, lululemon is down a rough 41.4%, and so far in 2024, its stock price has tumbled more than 52%. Even looking back three or five years, the returns are deeply negative, showing that the recent comeback is only a small part of a longer, more volatile story.
So, what's fueling these swings? Over the past few months, there has been ongoing buzz around shifting consumer spending habits and concerns about athletic-wear demand. Recent news about increasing international expansion and new product launches have added some optimism, but not enough to fully offset concerns about competitive pressures and changing retail sentiment. These themes are shaping how investors are thinking about risk and potential going forward.
If you’re wondering whether all this turmoil has actually left lululemon trading at a bargain, you’re in good company. On a purely valuation basis, the company scores a solid 5 out of 6, meaning it looks undervalued in almost every way analysts typically check. But, of course, there are always more layers to a great stock story. Next, we’ll break down how those valuation approaches stack up and hint at an even smarter way to think about lululemon’s true worth by the end of the article.
Why lululemon athletica is lagging behind its peers
Approach 1: lululemon athletica Discounted Cash Flow (DCF) Analysis
The Discounted Cash Flow (DCF) model works by projecting a company's future cash flows and then discounting them back to today’s dollars. The goal is to estimate the fair value of the business based on the cash it can generate for shareholders over time.
For lululemon athletica, the most recent Free Cash Flow stands at $1.16 Billion. Analyst estimates suggest steady growth, with Free Cash Flow projected to reach $1.60 Billion by 2030. It is important to note that while analysts cover the next five years, figures beyond that are extrapolations, intended to provide additional context rather than fixed forecasts.
Using the 2 Stage Free Cash Flow to Equity model, the intrinsic value per share is calculated to be $254.75. This is roughly 30.1% above the current market price, which means the stock is considered significantly undervalued by this method.
In summary, the DCF model indicates that lululemon shares are priced well below their long-term cash-generating potential.
Result: UNDERVALUED
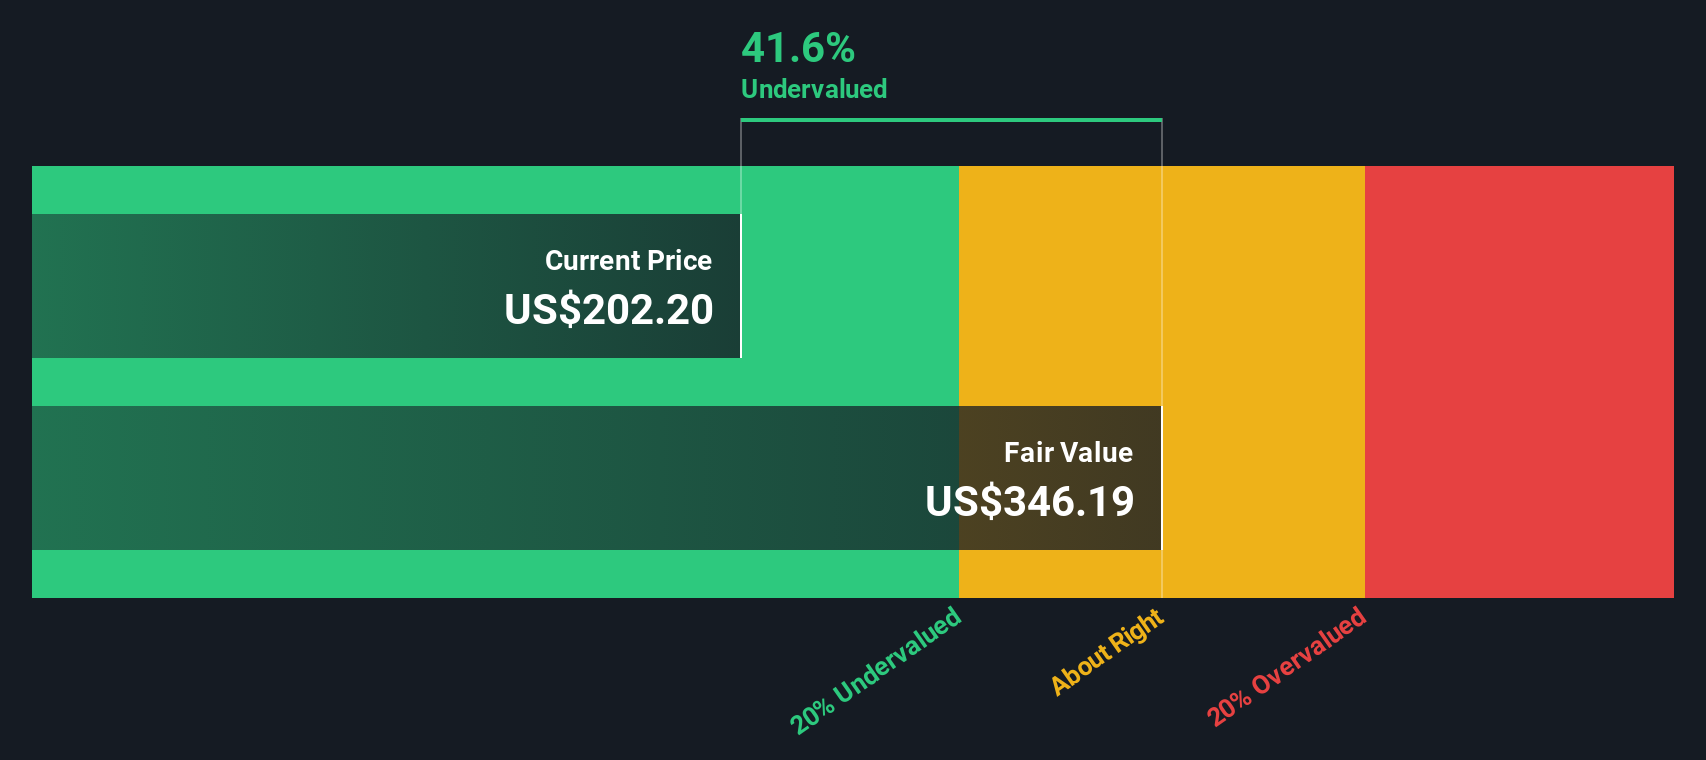
Our Discounted Cash Flow (DCF) analysis suggests lululemon athletica is undervalued by 30.1%. Track this in your watchlist or portfolio, or discover more undervalued stocks.
Approach 2: lululemon athletica Price vs Earnings
For profitable companies like lululemon athletica, the Price-to-Earnings (PE) ratio is a widely used and intuitive measure of value. It helps investors gauge how much the market is willing to pay today for a dollar of the company’s current earnings. A “normal” or fair PE ratio depends on how quickly a company is expected to grow and the risks it might face in sustaining that growth. High-growth, low-risk businesses can naturally command higher multiples. In contrast, slower-growing or riskier ones will trade at lower multiples.
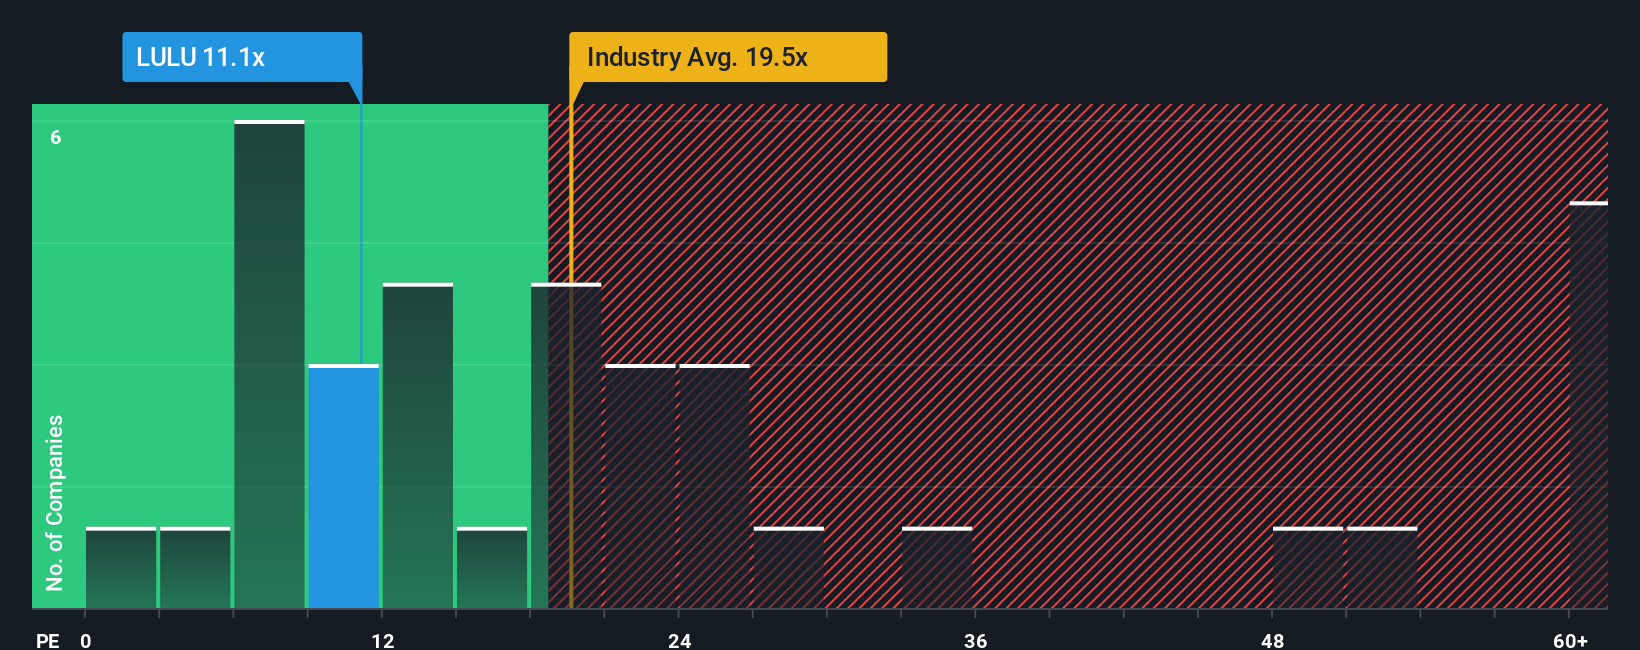
At the moment, lululemon is trading at a PE ratio of 11.8x. To put this in perspective, the average PE ratio for the luxury industry is 19.7x. The average across its peers is even higher, at 62.3x. On the surface, this makes lululemon look notably cheaper than both its direct competitors and the broader industry.
However, Simply Wall St’s “Fair Ratio” provides an even more powerful benchmark. The Fair Ratio for lululemon, incorporating the company’s specific earnings growth prospects, risk profile, profit margins, business model, and size, lands at 17.2x. This approach is more nuanced than simply comparing companies side by side, as it takes all those important factors into account and helps investors avoid traps set by superficial comparisons.
With lululemon’s actual PE of 11.8x compared to a Fair Ratio of 17.2x, the stock looks undervalued on this measure as well.
Result: UNDERVALUED
PE ratios tell one story, but what if the real opportunity lies elsewhere? Discover companies where insiders are betting big on explosive growth.
Upgrade Your Decision Making: Choose your lululemon athletica Narrative
Earlier, we mentioned there is an even better way to understand valuation. Let’s introduce you to Narratives. A Narrative is your own investing viewpoint, where you create a story about lululemon athletica, what you believe about its business, future growth, risks, and opportunities, and connect that story directly to a financial forecast and a calculated fair value.
With Narratives, you’re not just relying on headline numbers or models, but attaching your perspective to specific assumptions about things like future revenue, profit margins, and what you think a fair price should be if your story comes true. This approach makes your investment decision more transparent, personalized, and dynamic, and you can access these tools quickly and easily on Simply Wall St’s Community page, used by millions of real investors.
Narratives empower you to see whether your Fair Value estimate suggests the stock is a buy or sell right now. Every Narrative automatically updates as new news or earnings figures are released, helping your investment logic adapt in real time.
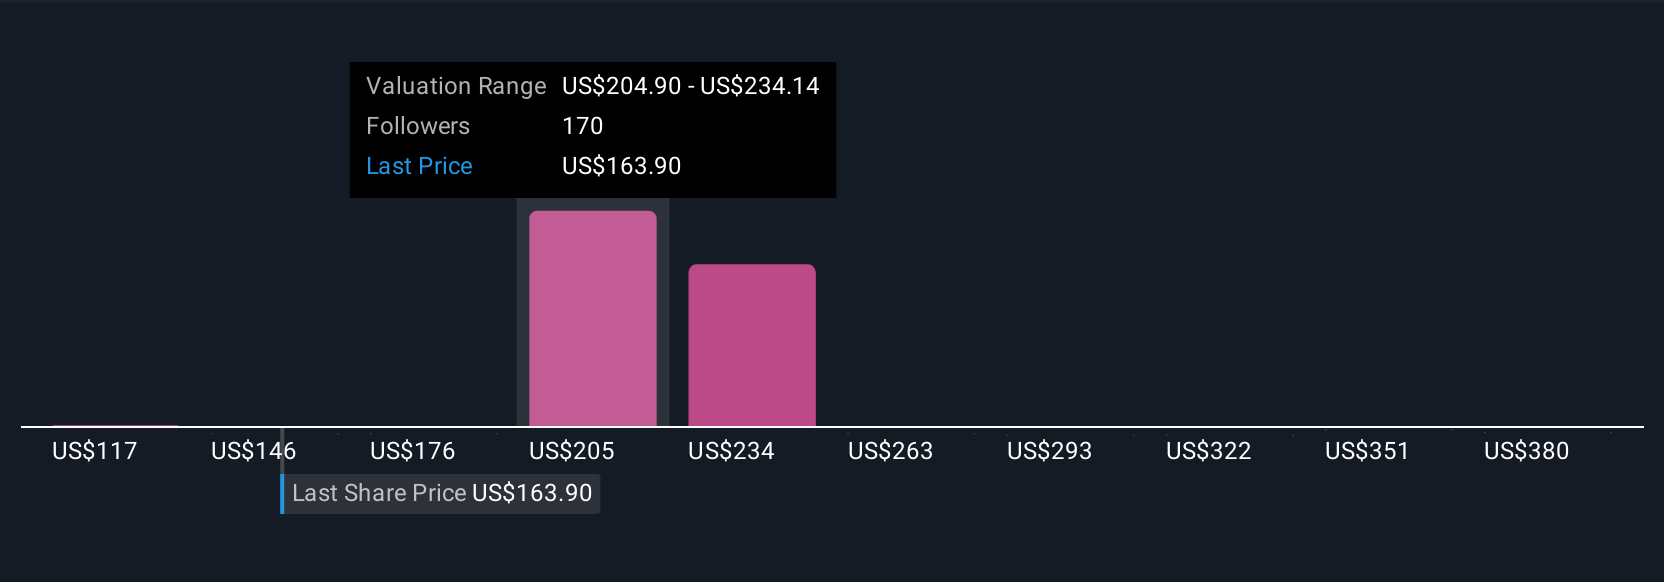
For example, some investors see lululemon athletica as still having strong upside, forecasting a fair value above $225 per share, while others think growth headwinds make it worth below $100. This shows that your narrative makes all the difference in your investment call.
Do you think there's more to the story for lululemon athletica? Create your own Narrative to let the Community know!
This article by Simply Wall St is general in nature. We provide commentary based on historical data and analyst forecasts only using an unbiased methodology and our articles are not intended to be financial advice. It does not constitute a recommendation to buy or sell any stock, and does not take account of your objectives, or your financial situation. We aim to bring you long-term focused analysis driven by fundamental data. Note that our analysis may not factor in the latest price-sensitive company announcements or qualitative material. Simply Wall St has no position in any stocks mentioned.
Valuation is complex, but we're here to simplify it.
Discover if lululemon athletica might be undervalued or overvalued with our detailed analysis, featuring fair value estimates, potential risks, dividends, insider trades, and its financial condition.
Access Free AnalysisHave feedback on this article? Concerned about the content? Get in touch with us directly. Alternatively, email editorial-team@simplywallst.com
About NasdaqGS:LULU
lululemon athletica
Designs, distributes, and retails technical athletic apparel, footwear, and accessories for women and men under the lululemon brand in the United States, Canada, Mexico, China Mainland, Hong Kong, Taiwan, Macau, and internationally.
Flawless balance sheet and undervalued.
Similar Companies
Market Insights

Advertisement
Community Narratives
Finding The True Value Of A Logistics Powerhouse
Fair Value US$95.21|8.4% undervalued
NV
Community Contributor
Paradigm Biopharmaceuticals Will Lead Osteoarthritis Treatment with Zilosul's FDA Success
Fair Value AU$5.50|92.1% undervalued
AM
Community Contributor
Barrick Mining (ABX:CA): A Gold Hedge against a U.S. Shutdown
Fair Value CA$60.00|24.2% undervalued
GM
Community Contributor