
Advertisement
- United States
- /
- Consumer Durables
- /
- OTCPK:DXYN
Is Dixie Group (NASDAQ:DXYN) Using Too Much Debt?
Howard Marks put it nicely when he said that, rather than worrying about share price volatility, 'The possibility of permanent loss is the risk I worry about... and every practical investor I know worries about.' It's only natural to consider a company's balance sheet when you examine how risky it is, since debt is often involved when a business collapses. We note that The Dixie Group, Inc. (NASDAQ:DXYN) does have debt on its balance sheet. But the more important question is: how much risk is that debt creating?
When Is Debt A Problem?
Debt is a tool to help businesses grow, but if a business is incapable of paying off its lenders, then it exists at their mercy. Ultimately, if the company can't fulfill its legal obligations to repay debt, shareholders could walk away with nothing. However, a more common (but still painful) scenario is that it has to raise new equity capital at a low price, thus permanently diluting shareholders. Having said that, the most common situation is where a company manages its debt reasonably well - and to its own advantage. When we examine debt levels, we first consider both cash and debt levels, together.
See our latest analysis for Dixie Group
What Is Dixie Group's Debt?
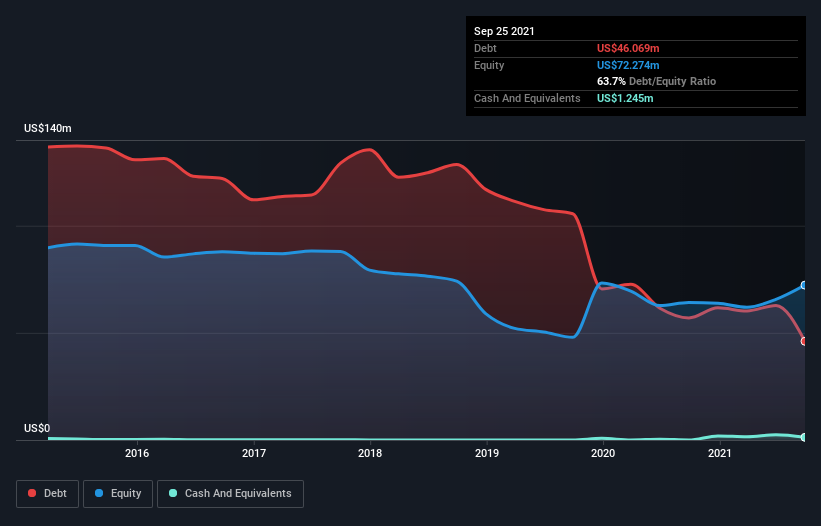
You can click the graphic below for the historical numbers, but it shows that Dixie Group had US$46.1m of debt in September 2021, down from US$57.0m, one year before. However, it also had US$1.25m in cash, and so its net debt is US$44.8m.
How Strong Is Dixie Group's Balance Sheet?
Zooming in on the latest balance sheet data, we can see that Dixie Group had liabilities of US$65.8m due within 12 months and liabilities of US$97.0m due beyond that. Offsetting this, it had US$1.25m in cash and US$42.0m in receivables that were due within 12 months. So its liabilities outweigh the sum of its cash and (near-term) receivables by US$119.6m.
This deficit casts a shadow over the US$59.6m company, like a colossus towering over mere mortals. So we'd watch its balance sheet closely, without a doubt. At the end of the day, Dixie Group would probably need a major re-capitalization if its creditors were to demand repayment.
We use two main ratios to inform us about debt levels relative to earnings. The first is net debt divided by earnings before interest, tax, depreciation, and amortization (EBITDA), while the second is how many times its earnings before interest and tax (EBIT) covers its interest expense (or its interest cover, for short). The advantage of this approach is that we take into account both the absolute quantum of debt (with net debt to EBITDA) and the actual interest expenses associated with that debt (with its interest cover ratio).
Dixie Group has net debt worth 1.5 times EBITDA, which isn't too much, but its interest cover looks a bit on the low side, with EBIT at only 3.6 times the interest expense. While these numbers do not alarm us, it's worth noting that the cost of the company's debt is having a real impact. We also note that Dixie Group improved its EBIT from a last year's loss to a positive US$19m. When analysing debt levels, the balance sheet is the obvious place to start. But it is Dixie Group's earnings that will influence how the balance sheet holds up in the future. So if you're keen to discover more about its earnings, it might be worth checking out this graph of its long term earnings trend.
Finally, a company can only pay off debt with cold hard cash, not accounting profits. So it's worth checking how much of the earnings before interest and tax (EBIT) is backed by free cash flow. During the last year, Dixie Group burned a lot of cash. While investors are no doubt expecting a reversal of that situation in due course, it clearly does mean its use of debt is more risky.
Our View
To be frank both Dixie Group's conversion of EBIT to free cash flow and its track record of staying on top of its total liabilities make us rather uncomfortable with its debt levels. But at least it's pretty decent at managing its debt, based on its EBITDA,; that's encouraging. After considering the datapoints discussed, we think Dixie Group has too much debt. While some investors love that sort of risky play, it's certainly not our cup of tea. When analysing debt levels, the balance sheet is the obvious place to start. But ultimately, every company can contain risks that exist outside of the balance sheet. For example Dixie Group has 4 warning signs (and 1 which is significant) we think you should know about.
When all is said and done, sometimes its easier to focus on companies that don't even need debt. Readers can access a list of growth stocks with zero net debt 100% free, right now.
New: Manage All Your Stock Portfolios in One Place
We've created the ultimate portfolio companion for stock investors, and it's free.
• Connect an unlimited number of Portfolios and see your total in one currency
• Be alerted to new Warning Signs or Risks via email or mobile
• Track the Fair Value of your stocks
Have feedback on this article? Concerned about the content? Get in touch with us directly. Alternatively, email editorial-team (at) simplywallst.com.
This article by Simply Wall St is general in nature. We provide commentary based on historical data and analyst forecasts only using an unbiased methodology and our articles are not intended to be financial advice. It does not constitute a recommendation to buy or sell any stock, and does not take account of your objectives, or your financial situation. We aim to bring you long-term focused analysis driven by fundamental data. Note that our analysis may not factor in the latest price-sensitive company announcements or qualitative material. Simply Wall St has no position in any stocks mentioned.
MI

The Foxhole
Druckenmiller says cheap money's days are numbered. Boring, self-funding companies could be the opportunity.
1311
DE
devon_jd150
Leverage on its own is close to useless as a screen right now, because so much corporate debt was termed out at 2 to 3% and has not repriced. A business at three times leverage with nothing due until 2031 is in a completely different position from the same ratio rolling next year. Screen on weighted average maturity and the schedule behind it.
LE
LeverageIsLovely
In my view, Insurance companies are best positioned for this.
 Mitchell Lawler
Market Insights
Which payment stocks actually get paid?

Every new payment app was supposed to kill Visa and Mastercard. Instead, they got bigger. So what does that mean for the payment stocks on your radar?
32
About OTCPK:DXYN
Dixie Group
Manufactures, markets, and sells floorcovering products to residential customers in North America and internationally.
Slight risk and slightly overvalued.
Similar Companies
Market Insights


Advertisement
Weekly Picks
RI


Rick_Orford on Starfighters Space ·
The 1960s Fighter Jet That Could Crack Open a $20 Billion Satellite Market
Fair Value:US$522.8% undervalued
67 followersusers have followed this narrative
4 commentsusers have commented on this narrative
11 likesusers have liked this narrative
TR


tripledub on Meta Platforms ·
The $135 Billion Bet That Should Make Every Shareholder Nervous
Fair Value:US$5862.7% undervalued
48 followersusers have followed this narrative
3 commentsusers have commented on this narrative
34 likesusers have liked this narrative
TA


Talos on Voyager Technologies ·
The "Landlord of Orbit" – A Deep Value Play Ahead of the Starlab Era
Fair Value:US$385.291.0% undervalued
31 followersusers have followed this narrative
0 commentsusers have commented on this narrative
5 likesusers have liked this narrative
IV

Ivoed on Uber Technologies ·
Uber’s Valuation Depends On Who Captures The Economics Of Driverless Rides
Fair Value:US$11630.7% undervalued
7 followersusers have followed this narrative
0 commentsusers have commented on this narrative
3 likesusers have liked this narrative
Recently Updated Narratives
WO


woodworthfund on Kraft Heinz ·
Kraft Heinz (KHC): Less Drama, More Ketchup
Fair Value:US$3527.7% undervalued
27 followersusers have followed this narrative
0 commentsusers have commented on this narrative
0 likesusers have liked this narrative
LU


LunaRodas on DICK'S Sporting Goods ·
DKS | DICK'S Sporting Goods: What They Said vs. What They Did
Fair Value:US$112.7710.2% overvalued
1 followerusers have followed this narrative
0 commentsusers have commented on this narrative
0 likesusers have liked this narrative
PR


prajeeshprathap on Medpace Holdings ·
Why Medpace Outperforms Competitors in the Mid-Sized Biotech Niche
Fair Value:US$53614.6% overvalued
1 followerusers have followed this narrative
0 commentsusers have commented on this narrative
0 likesusers have liked this narrative
Popular Narratives
OS


oscargarcia on NVIDIA ·
The company that went from selling GPUs to gamers to becoming the AI arms dealer of the 21st century.
Fair Value:US$28023.9% undervalued
355 followersusers have followed this narrative
9 commentsusers have commented on this narrative
16 likesusers have liked this narrative
CU

CubanEros on Microsoft ·
A wonderful business at reasonable price.
Fair Value:US$419.9117.1% overvalued
204 followersusers have followed this narrative
0 commentsusers have commented on this narrative
9 likesusers have liked this narrative
KI

KiwiInvest on Amazon.com ·
Amazon's high growth, high tech segments propel its profits, while traditional segments plod along
Fair Value:US$475.0945.1% undervalued
228 followersusers have followed this narrative
1 commentusers have commented on this narrative
8 likesusers have liked this narrative
Trending Discussion


JO
johnk72 on Global X AI Infrastructure ETF ·
Great picks & shovels investment. I hold 3,000 units with a plan to hold until the end of 2028
2
|0