
Advertisement
- United States
- /
- Commercial Services
- /
- NYSE:WCN
Is Waste Connections, Inc.'s (NYSE:WCN) High P/E Ratio A Problem For Investors?

Today, we'll introduce the concept of the P/E ratio for those who are learning about investing. We'll look at Waste Connections, Inc.'s (NYSE:WCN) P/E ratio and reflect on what it tells us about the company's share price. Looking at earnings over the last twelve months, Waste Connections has a P/E ratio of 43.44. In other words, at today's prices, investors are paying $43.44 for every $1 in prior year profit.
Check out our latest analysis for Waste Connections
How Do I Calculate Waste Connections's Price To Earnings Ratio?
The formula for P/E is:
Price to Earnings Ratio = Price per Share ÷ Earnings per Share (EPS)
Or for Waste Connections:
P/E of 43.44 = $91.9 ÷ $2.12 (Based on the year to June 2019.)
Is A High Price-to-Earnings Ratio Good?
A higher P/E ratio means that investors are paying a higher price for each $1 of company earnings. That isn't necessarily good or bad, but a high P/E implies relatively high expectations of what a company can achieve in the future.
Does Waste Connections Have A Relatively High Or Low P/E For Its Industry?
The P/E ratio essentially measures market expectations of a company. The image below shows that Waste Connections has a higher P/E than the average (24.1) P/E for companies in the commercial services industry.
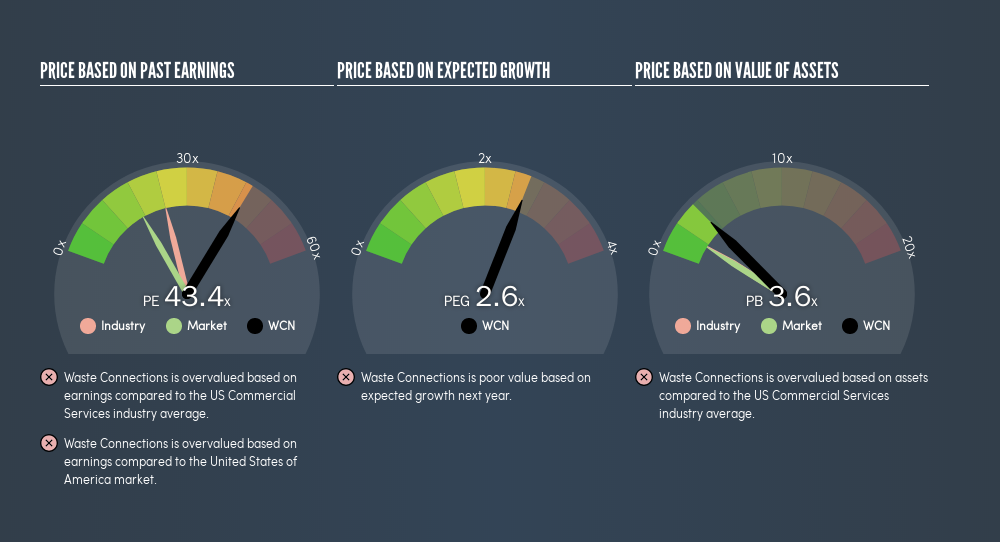
Waste Connections's P/E tells us that market participants think the company will perform better than its industry peers, going forward.
How Growth Rates Impact P/E Ratios
Earnings growth rates have a big influence on P/E ratios. If earnings are growing quickly, then the 'E' in the equation will increase faster than it would otherwise. That means even if the current P/E is high, it will reduce over time if the share price stays flat. So while a stock may look expensive based on past earnings, it could be cheap based on future earnings.
Waste Connections shrunk earnings per share by 20% over the last year. But over the longer term (5 years) earnings per share have increased by 12%.
Remember: P/E Ratios Don't Consider The Balance Sheet
It's important to note that the P/E ratio considers the market capitalization, not the enterprise value. That means it doesn't take debt or cash into account. Theoretically, a business can improve its earnings (and produce a lower P/E in the future) by investing in growth. That means taking on debt (or spending its cash).
Spending on growth might be good or bad a few years later, but the point is that the P/E ratio does not account for the option (or lack thereof).
So What Does Waste Connections's Balance Sheet Tell Us?
Waste Connections has net debt worth 16% of its market capitalization. It would probably deserve a higher P/E ratio if it was net cash, since it would have more options for growth.
The Bottom Line On Waste Connections's P/E Ratio
Waste Connections has a P/E of 43.4. That's higher than the average in its market, which is 17.3. With modest debt but no EPS growth in the last year, it's fair to say the P/E implies some optimism about future earnings, from the market.
Investors have an opportunity when market expectations about a stock are wrong. As value investor Benjamin Graham famously said, 'In the short run, the market is a voting machine but in the long run, it is a weighing machine.' So this free report on the analyst consensus forecasts could help you make a master move on this stock.
Of course you might be able to find a better stock than Waste Connections. So you may wish to see this free collection of other companies that have grown earnings strongly.
We aim to bring you long-term focused research analysis driven by fundamental data. Note that our analysis may not factor in the latest price-sensitive company announcements or qualitative material.
If you spot an error that warrants correction, please contact the editor at editorial-team@simplywallst.com. This article by Simply Wall St is general in nature. It does not constitute a recommendation to buy or sell any stock, and does not take account of your objectives, or your financial situation. Simply Wall St has no position in the stocks mentioned. Thank you for reading.
About NYSE:WCN
Waste Connections
Provides non-hazardous waste collection, transfer, disposal, and resource recovery services in the United States and Canada.
Moderate growth potential with questionable track record.
Similar Companies
Market Insights


Advertisement
Community Narratives
A case for TSXV:USA to reach USD $5.00 - $9.00 (CAD $7.30–$12.29) by 2029.
Fair Value CA$12.29|91.1% undervalued
AG
Community Contributor
DLocal's Future Growth Fueled by 35% Revenue and Profit Margin Boosts
Fair Value US$195.39|94.2% undervalued
WY
Community Contributor
Historically Cheap, but the Margin of Safety Is Still Thin
Fair Value SEK 232.58|13.2% undervalued
MA
Community Contributor