
Advertisement
- United States
- /
- Professional Services
- /
- NYSE:TBI
The Returns On Capital At TrueBlue (NYSE:TBI) Don't Inspire Confidence

When it comes to investing, there are some useful financial metrics that can warn us when a business is potentially in trouble. A business that's potentially in decline often shows two trends, a return on capital employed (ROCE) that's declining, and a base of capital employed that's also declining. This reveals that the company isn't compounding shareholder wealth because returns are falling and its net asset base is shrinking. On that note, looking into TrueBlue (NYSE:TBI), we weren't too upbeat about how things were going.
What is Return On Capital Employed (ROCE)?
If you haven't worked with ROCE before, it measures the 'return' (pre-tax profit) a company generates from capital employed in its business. Analysts use this formula to calculate it for TrueBlue:
Return on Capital Employed = Earnings Before Interest and Tax (EBIT) ÷ (Total Assets - Current Liabilities)
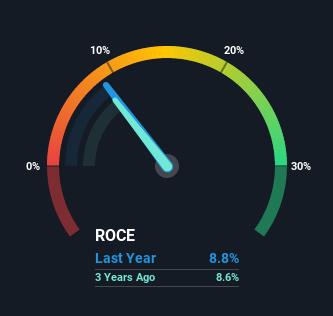
0.088 = US$68m ÷ (US$1.0b - US$259m) (Based on the trailing twelve months to December 2021).
Therefore, TrueBlue has an ROCE of 8.8%. On its own, that's a low figure but it's around the 10% average generated by the Professional Services industry.
View our latest analysis for TrueBlue
In the above chart we have measured TrueBlue's prior ROCE against its prior performance, but the future is arguably more important. If you'd like, you can check out the forecasts from the analysts covering TrueBlue here for free.
The Trend Of ROCE
We are a bit worried about the trend of returns on capital at TrueBlue. Unfortunately the returns on capital have diminished from the 11% that they were earning five years ago. Meanwhile, capital employed in the business has stayed roughly the flat over the period. Companies that exhibit these attributes tend to not be shrinking, but they can be mature and facing pressure on their margins from competition. If these trends continue, we wouldn't expect TrueBlue to turn into a multi-bagger.
What We Can Learn From TrueBlue's ROCE
In summary, it's unfortunate that TrueBlue is generating lower returns from the same amount of capital. And long term shareholders have watched their investments stay flat over the last five years. Unless there is a shift to a more positive trajectory in these metrics, we would look elsewhere.
On a final note, we've found 1 warning sign for TrueBlue that we think you should be aware of.
While TrueBlue isn't earning the highest return, check out this free list of companies that are earning high returns on equity with solid balance sheets.
Valuation is complex, but we're here to simplify it.
Discover if TrueBlue might be undervalued or overvalued with our detailed analysis, featuring fair value estimates, potential risks, dividends, insider trades, and its financial condition.
Access Free AnalysisHave feedback on this article? Concerned about the content? Get in touch with us directly. Alternatively, email editorial-team (at) simplywallst.com.
This article by Simply Wall St is general in nature. We provide commentary based on historical data and analyst forecasts only using an unbiased methodology and our articles are not intended to be financial advice. It does not constitute a recommendation to buy or sell any stock, and does not take account of your objectives, or your financial situation. We aim to bring you long-term focused analysis driven by fundamental data. Note that our analysis may not factor in the latest price-sensitive company announcements or qualitative material. Simply Wall St has no position in any stocks mentioned.
About NYSE:TBI
TrueBlue
Provides specialized workforce solutions in the United States, Canada, the United Kingdom, Australia, and Puerto Rico.
Undervalued with adequate balance sheet.
Similar Companies
Market Insights

Advertisement
Community Narratives
Vita Life Sciences Set for a 12.72% Revenue Growth While Tackling Operational Challenges
Fair Value AU$2.42|9.1% undervalued
RO
Community Contributor
Vossloh rides a €500 billion wave to boost growth and earnings in the next decade
Fair Value €78.41|5.2% undervalued
CH
Community Contributor
Intuitive Surgical Will Transform Healthcare with 12% Revenue Growth
Fair Value US$325.55|57.3% overvalued
UN
Community Contributor