Advertisement
- United States
- /
- Professional Services
- /
- NYSE:MMS
Is Maximus a Bargain After Its Latest Government Services Expansion News?

Simply Wall St
Reviewed by Bailey Pemberton
- Wondering whether Maximus is a bargain or overvalued right now? If you are curious about the true worth of this stock, you are not alone.
- The share price has dipped 3.5% over the past week and is down 10.7% in the last month, but is still up 2.6% year-to-date. This gives mixed signals about investor sentiment and potential risk or growth.
- Maximus has recently been in the spotlight following several key contract announcements and expansion news. These updates related to government services expansion have sparked debate about the company’s ability to deliver steady growth in changing markets.
- According to our checks, Maximus scores a 5 out of 6 on our valuation test, showing strong undervaluation indicators. We will dive into the different ways analysts put a price tag on Maximus, and at the end, reveal an even better way to tell if it is truly a value opportunity.
Approach 1: Maximus Discounted Cash Flow (DCF) Analysis
The Discounted Cash Flow (DCF) model estimates a company’s intrinsic value by projecting its future free cash flows and then discounting them back to today’s dollar value. This helps investors gauge whether a stock is trading above or below its fundamental worth based on expected financial performance.
For Maximus, current free cash flow stands at negative $160.81 million. Looking ahead, analysts expect positive growth, projecting annual free cash flows to reach $408 million by 2027. Over the next decade, with estimates and further extrapolation, Maximus’s free cash flows are expected to grow steadily, reaching approximately $553.94 million by 2035. These projections are in US dollars, matching the stock’s primary reporting currency.
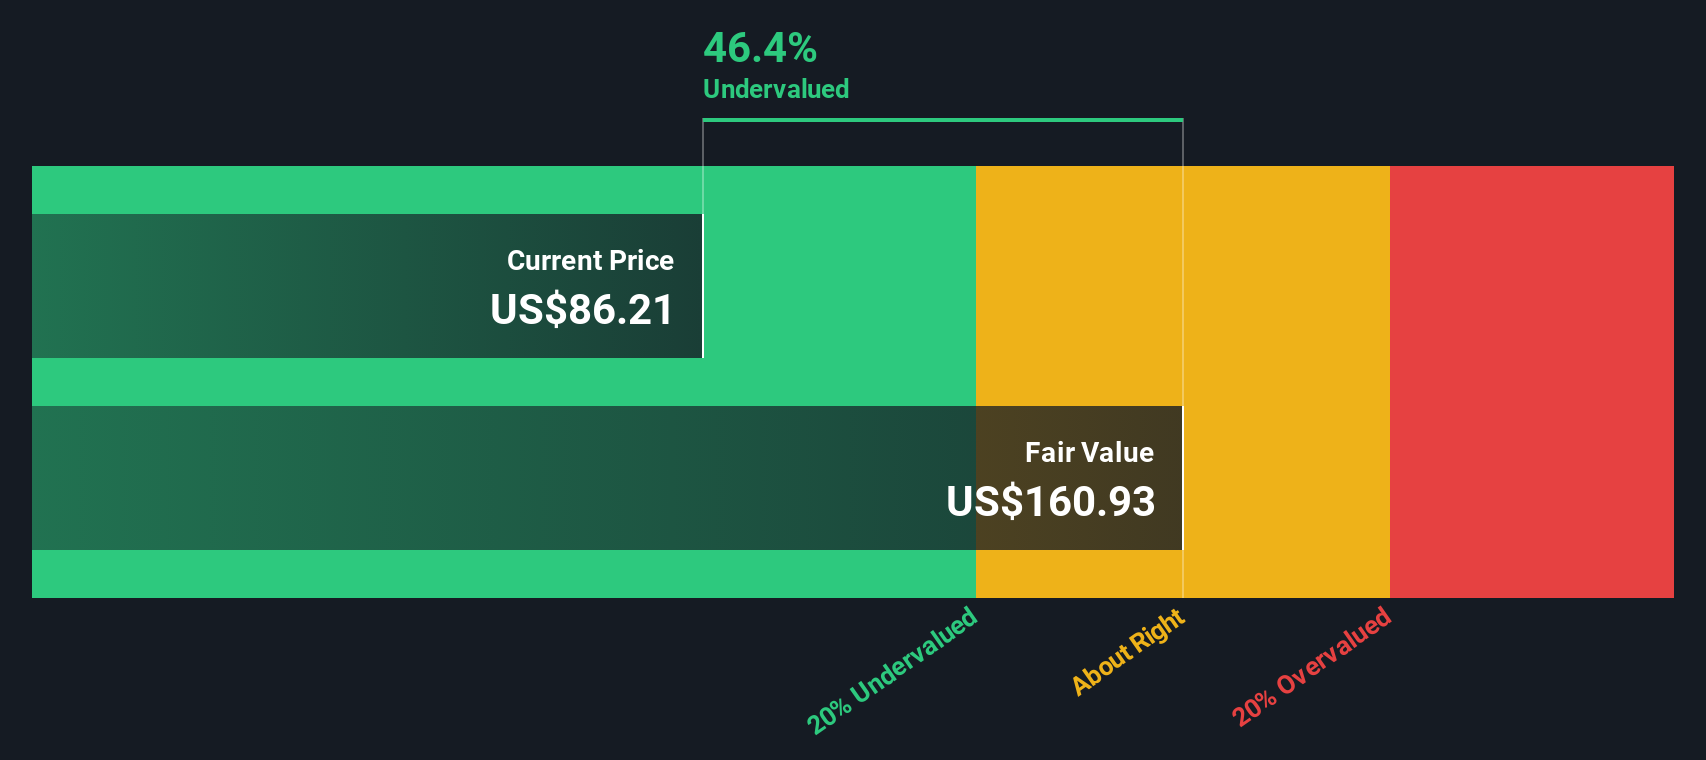
By applying the 2 Stage Free Cash Flow to Equity DCF model, the calculated intrinsic value for Maximus stock is $158.11 per share. This is significantly higher than its recent share price, resulting in a discount of 50.8 percent.
This analysis suggests that, based on cash flow fundamentals, Maximus appears markedly undervalued in the current market.
Result: UNDERVALUED
Our Discounted Cash Flow (DCF) analysis suggests Maximus is undervalued by 50.8%. Track this in your watchlist or portfolio, or discover 898 more undervalued stocks based on cash flows.
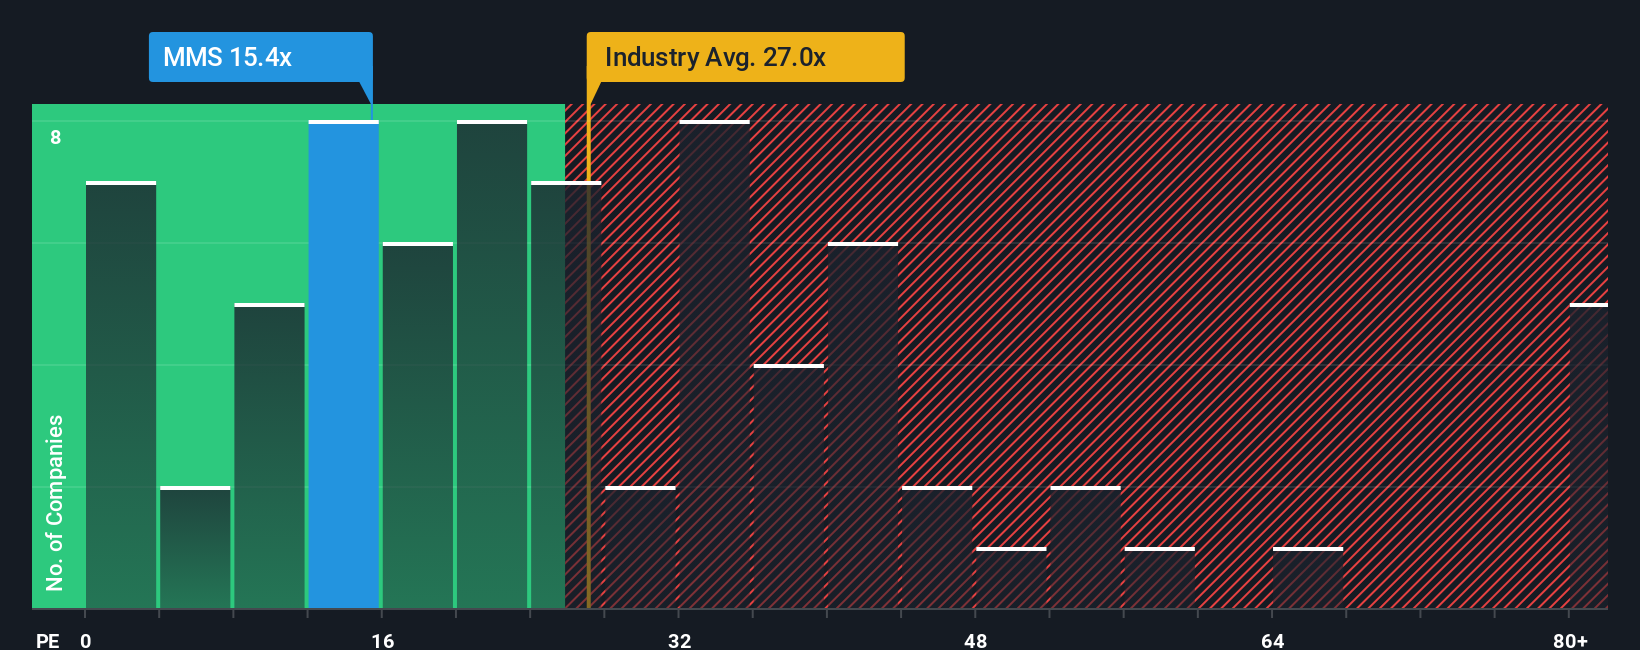
Approach 2: Maximus Price vs Earnings
The price-to-earnings (PE) ratio is a go-to metric for valuing profitable companies like Maximus because it captures how much investors are willing to pay for each dollar of earnings. When a company shows consistent profits, the PE ratio provides a direct window into market expectations about its growth trajectory and overall risk profile.
Typically, companies with higher growth or lower risk are rewarded with a higher “normal” or “fair” PE. In contrast, slower or riskier businesses trade at lower multiples. For Maximus, the current PE ratio is 13.9x, noticeably lower than the professional services industry average of 23.3x and the peer average of 33.3x. This suggests the market is currently valuing Maximus more conservatively compared to its broader sector and direct competitors.
However, Simply Wall St’s proprietary “Fair Ratio” brings more nuance to the comparison. Unlike a simple industry or peer average, the Fair Ratio (here, 23.0x) factors in Maximus’s specific earnings growth, profit margins, market cap, industry positioning, and risk profile to provide a smarter benchmark. This makes it a better yardstick for determining value than simply looking at what others are paying for similar companies.
Given that Maximus’s actual PE ratio of 13.9x is well below our calculated Fair Ratio of 23.0x, the stock appears materially undervalued on this metric.
Result: UNDERVALUED
PE ratios tell one story, but what if the real opportunity lies elsewhere? Discover 1416 companies where insiders are betting big on explosive growth.
Upgrade Your Decision Making: Choose your Maximus Narrative
Earlier we mentioned that there is an even better way to understand valuation. Let's introduce you to Narratives. A Narrative is your personalized story about Maximus, combining your beliefs about the company's business outlook, growth drivers, margins, and risks into a transparent, dynamic forecast. All of this is linked directly to your own fair value estimate.
Narratives are not complicated financial models. They are approachable tools available to everyone within the Simply Wall St Community, trusted by millions of investors. With a Narrative, you simply capture your perspective: Do you see Maximus benefiting from new government contracts? Or do you anticipate headwinds from tech disruption? Create your assumptions around future revenues, profit margins, and market shifts. The platform instantly connects your story to a tangible fair value, helping you decide whether to buy, hold, or sell as market prices and news change.
Because Narratives update in real time with new earnings, contracts, or regulatory changes, you can easily see how changing events affect your thesis. For example, one Narrative might assume bullish trends from digital transformation and price Maximus fairly at $120. Another, more cautious Narrative, sees risks from budget pressures and computes a value as low as $90. By comparing your Narrative to the current price, you gain a clear, actionable framework for every investment decision.
Do you think there's more to the story for Maximus? Head over to our Community to see what others are saying!
This article by Simply Wall St is general in nature. We provide commentary based on historical data and analyst forecasts only using an unbiased methodology and our articles are not intended to be financial advice. It does not constitute a recommendation to buy or sell any stock, and does not take account of your objectives, or your financial situation. We aim to bring you long-term focused analysis driven by fundamental data. Note that our analysis may not factor in the latest price-sensitive company announcements or qualitative material. Simply Wall St has no position in any stocks mentioned.
New: Manage All Your Stock Portfolios in One Place
We've created the ultimate portfolio companion for stock investors, and it's free.
• Connect an unlimited number of Portfolios and see your total in one currency
• Be alerted to new Warning Signs or Risks via email or mobile
• Track the Fair Value of your stocks
Have feedback on this article? Concerned about the content? Get in touch with us directly. Alternatively, email editorial-team@simplywallst.com
About NYSE:MMS
Undervalued with proven track record.
Similar Companies
Market Insights

Advertisement
Community Narratives
MicroVision will explode future revenue by 380.37% with a vision towards success
Fair Value US$60.00|98.5% undervalued
TH
Community Contributor
The Indispensable Artery for a New North American Economy
Fair Value CA$132.87|2.3% undervalued
TI
Community Contributor