- United States
- /
- Professional Services
- /
- NYSE:MMS
Investing in Maximus (NYSE:MMS) five years ago would have delivered you a 31% gain


If you buy and hold a stock for many years, you'd hope to be making a profit. Furthermore, you'd generally like to see the share price rise faster than the market. Unfortunately for shareholders, while the Maximus, Inc. (NYSE:MMS) share price is up 22% in the last five years, that's less than the market return. Zooming in, the stock is up a respectable 6.6% in the last year.
So let's investigate and see if the longer term performance of the company has been in line with the underlying business' progress.
Check out our latest analysis for Maximus
In his essay The Superinvestors of Graham-and-Doddsville Warren Buffett described how share prices do not always rationally reflect the value of a business. One imperfect but simple way to consider how the market perception of a company has shifted is to compare the change in the earnings per share (EPS) with the share price movement.
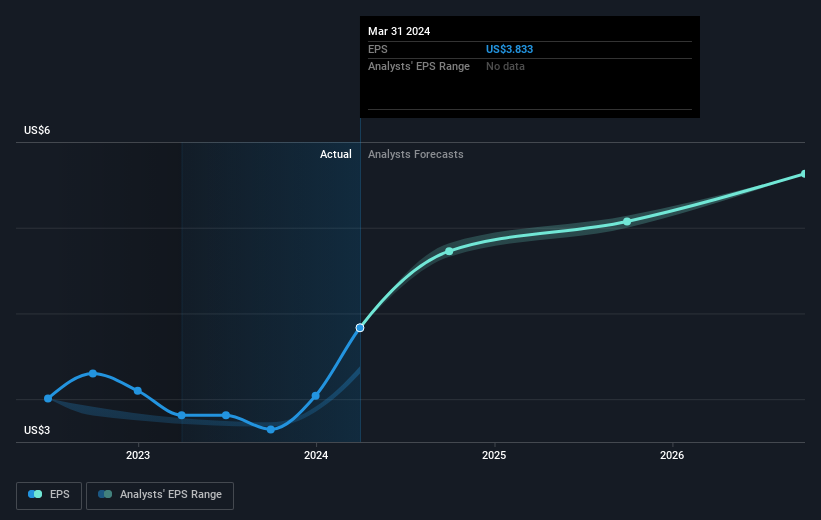
Over half a decade, Maximus managed to grow its earnings per share at 2.3% a year. This EPS growth is slower than the share price growth of 4% per year, over the same period. So it's fair to assume the market has a higher opinion of the business than it did five years ago. That's not necessarily surprising considering the five-year track record of earnings growth.
The graphic below depicts how EPS has changed over time (unveil the exact values by clicking on the image).
We consider it positive that insiders have made significant purchases in the last year. Having said that, most people consider earnings and revenue growth trends to be a more meaningful guide to the business. This free interactive report on Maximus' earnings, revenue and cash flow is a great place to start, if you want to investigate the stock further.
What About Dividends?
It is important to consider the total shareholder return, as well as the share price return, for any given stock. The TSR is a return calculation that accounts for the value of cash dividends (assuming that any dividend received was reinvested) and the calculated value of any discounted capital raisings and spin-offs. So for companies that pay a generous dividend, the TSR is often a lot higher than the share price return. As it happens, Maximus' TSR for the last 5 years was 31%, which exceeds the share price return mentioned earlier. The dividends paid by the company have thusly boosted the total shareholder return.
A Different Perspective
Maximus shareholders gained a total return of 8.2% during the year. But that was short of the market average. The silver lining is that the gain was actually better than the average annual return of 6% per year over five year. It is possible that returns will improve along with the business fundamentals. While it is well worth considering the different impacts that market conditions can have on the share price, there are other factors that are even more important. Even so, be aware that Maximus is showing 1 warning sign in our investment analysis , you should know about...
There are plenty of other companies that have insiders buying up shares. You probably do not want to miss this free list of undervalued small cap companies that insiders are buying.
Please note, the market returns quoted in this article reflect the market weighted average returns of stocks that currently trade on American exchanges.
New: Manage All Your Stock Portfolios in One Place
We've created the ultimate portfolio companion for stock investors, and it's free.
• Connect an unlimited number of Portfolios and see your total in one currency
• Be alerted to new Warning Signs or Risks via email or mobile
• Track the Fair Value of your stocks
Have feedback on this article? Concerned about the content? Get in touch with us directly. Alternatively, email editorial-team (at) simplywallst.com.
This article by Simply Wall St is general in nature. We provide commentary based on historical data and analyst forecasts only using an unbiased methodology and our articles are not intended to be financial advice. It does not constitute a recommendation to buy or sell any stock, and does not take account of your objectives, or your financial situation. We aim to bring you long-term focused analysis driven by fundamental data. Note that our analysis may not factor in the latest price-sensitive company announcements or qualitative material. Simply Wall St has no position in any stocks mentioned.
Have feedback on this article? Concerned about the content? Get in touch with us directly. Alternatively, email editorial-team@simplywallst.com
About NYSE:MMS
Maximus
Operates as a provider of government services in the United States and internationally.
Undervalued with proven track record and pays a dividend.

