Stock Analysis
- United States
- /
- Commercial Services
- /
- NYSE:DLX
Investors five-year losses continue as Deluxe (NYSE:DLX) dips a further 7.5% this week, earnings continue to decline

For many, the main point of investing is to generate higher returns than the overall market. But even the best stock picker will only win with some selections. At this point some shareholders may be questioning their investment in Deluxe Corporation (NYSE:DLX), since the last five years saw the share price fall 60%. On top of that, the share price is down 7.5% in the last week. However, this move may have been influenced by the broader market, which fell 3.5% in that time.
If the past week is anything to go by, investor sentiment for Deluxe isn't positive, so let's see if there's a mismatch between fundamentals and the share price.
See our latest analysis for Deluxe
To quote Buffett, 'Ships will sail around the world but the Flat Earth Society will flourish. There will continue to be wide discrepancies between price and value in the marketplace...' By comparing earnings per share (EPS) and share price changes over time, we can get a feel for how investor attitudes to a company have morphed over time.
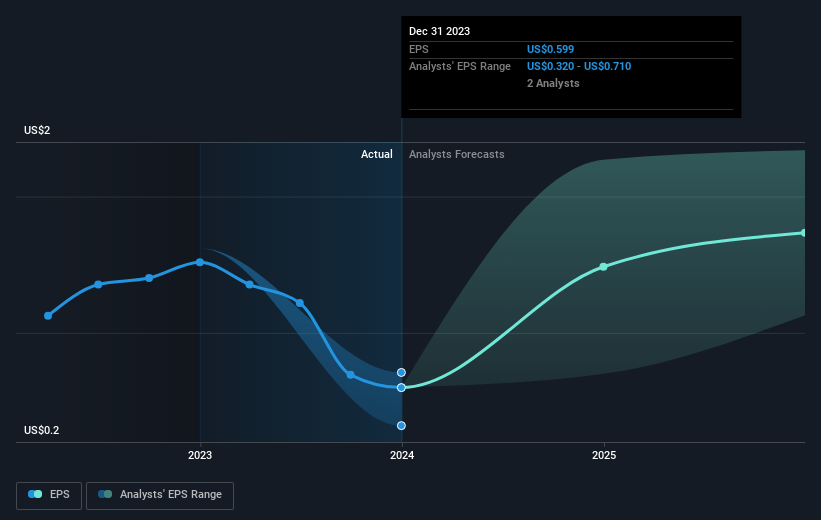
During the five years over which the share price declined, Deluxe's earnings per share (EPS) dropped by 29% each year. The share price decline of 17% per year isn't as bad as the EPS decline. So the market may previously have expected a drop, or else it expects the situation will improve.
The graphic below depicts how EPS has changed over time (unveil the exact values by clicking on the image).
We know that Deluxe has improved its bottom line over the last three years, but what does the future have in store? You can see how its balance sheet has strengthened (or weakened) over time in this free interactive graphic.
What About Dividends?
It is important to consider the total shareholder return, as well as the share price return, for any given stock. Whereas the share price return only reflects the change in the share price, the TSR includes the value of dividends (assuming they were reinvested) and the benefit of any discounted capital raising or spin-off. Arguably, the TSR gives a more comprehensive picture of the return generated by a stock. We note that for Deluxe the TSR over the last 5 years was -49%, which is better than the share price return mentioned above. And there's no prize for guessing that the dividend payments largely explain the divergence!
A Different Perspective
It's nice to see that Deluxe shareholders have received a total shareholder return of 30% over the last year. Of course, that includes the dividend. Notably the five-year annualised TSR loss of 8% per year compares very unfavourably with the recent share price performance. This makes us a little wary, but the business might have turned around its fortunes. While it is well worth considering the different impacts that market conditions can have on the share price, there are other factors that are even more important. Consider for instance, the ever-present spectre of investment risk. We've identified 4 warning signs with Deluxe (at least 1 which is a bit concerning) , and understanding them should be part of your investment process.
If you are like me, then you will not want to miss this free list of growing companies that insiders are buying.
Please note, the market returns quoted in this article reflect the market weighted average returns of stocks that currently trade on American exchanges.
Valuation is complex, but we're helping make it simple.
Find out whether Deluxe is potentially over or undervalued by checking out our comprehensive analysis, which includes fair value estimates, risks and warnings, dividends, insider transactions and financial health.
View the Free AnalysisHave feedback on this article? Concerned about the content? Get in touch with us directly. Alternatively, email editorial-team (at) simplywallst.com.
This article by Simply Wall St is general in nature. We provide commentary based on historical data and analyst forecasts only using an unbiased methodology and our articles are not intended to be financial advice. It does not constitute a recommendation to buy or sell any stock, and does not take account of your objectives, or your financial situation. We aim to bring you long-term focused analysis driven by fundamental data. Note that our analysis may not factor in the latest price-sensitive company announcements or qualitative material. Simply Wall St has no position in any stocks mentioned.

Simply Wall St
About NYSE:DLX
Deluxe
Deluxe Corporation provides technology-enabled solutions to enterprises, small businesses, and financial institutions in the United States, Canada, and Australia.
Established dividend payer and fair value.
