
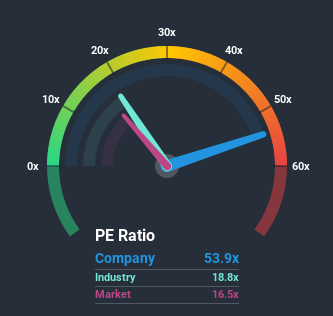
CoreLogic, Inc.'s (NYSE:CLGX) price-to-earnings (or "P/E") ratio of 53.9x might make it look like a strong sell right now compared to the market in the United States, where around half of the companies have P/E ratios below 16x and even P/E's below 9x are quite common. Nonetheless, we'd need to dig a little deeper to determine if there is a rational basis for the highly elevated P/E.
CoreLogic certainly has been doing a good job lately as it's been growing earnings more than most other companies. The P/E is probably high because investors think this strong earnings performance will continue. If not, then existing shareholders might be a little nervous about the viability of the share price.
See our latest analysis for CoreLogic
How Does CoreLogic's P/E Ratio Compare To Its Industry Peers?
We'd like to see if P/E's within CoreLogic's industry might provide some colour around the company's particularly high P/E ratio. It turns out the Professional Services industry in general also has a P/E ratio higher than the market, as the graphic below shows. So we'd say there could be some merit in the premise that the company's ratio being shaped by its industry at this time. Some industry P/E's don't move around a lot and right now most companies within the Professional Services industry should be getting a boost. Nonetheless, the greatest force on the company's P/E will be its own earnings growth expectations.
What Are Growth Metrics Telling Us About The High P/E?
There's an inherent assumption that a company should far outperform the market for P/E ratios like CoreLogic's to be considered reasonable.
If we review the last year of earnings growth, the company posted a worthy increase of 5.3%. EPS has also lifted 13% in aggregate from three years ago, partly thanks to the last 12 months of growth. So we can start by confirming that the company has actually done a good job of growing earnings over that time.
Looking ahead now, EPS is anticipated to climb by 14% per annum during the coming three years according to the nine analysts following the company. With the market only predicted to deliver 8.9% each year, the company is positioned for a stronger earnings result.
With this information, we can see why CoreLogic is trading at such a high P/E compared to the market. It seems most investors are expecting this strong future growth and are willing to pay more for the stock.
The Key Takeaway
Generally, our preference is to limit the use of the price-to-earnings ratio to establishing what the market thinks about the overall health of a company.
We've established that CoreLogic maintains its high P/E on the strength of its forecast growth being higher than the wider market, as expected. Right now shareholders are comfortable with the P/E as they are quite confident future earnings aren't under threat. It's hard to see the share price falling strongly in the near future under these circumstances.
Having said that, be aware CoreLogic is showing 4 warning signs in our investment analysis, you should know about.
Of course, you might also be able to find a better stock than CoreLogic. So you may wish to see this free collection of other companies that sit on P/E's below 20x and have grown earnings strongly.
If you decide to trade CoreLogic, use the lowest-cost* platform that is rated #1 Overall by Barron’s, Interactive Brokers. Trade stocks, options, futures, forex, bonds and funds on 135 markets, all from a single integrated account.Promoted
The New Payments ETF Is Live on NASDAQ:
Money is moving to real-time rails, and a newly listed ETF now gives investors direct exposure. Fast settlement. Institutional custody. Simple access.
Explore how this launch could reshape portfolios
Sponsored ContentNew: Manage All Your Stock Portfolios in One Place
We've created the ultimate portfolio companion for stock investors, and it's free.
• Connect an unlimited number of Portfolios and see your total in one currency
• Be alerted to new Warning Signs or Risks via email or mobile
• Track the Fair Value of your stocks
This article by Simply Wall St is general in nature. It does not constitute a recommendation to buy or sell any stock, and does not take account of your objectives, or your financial situation. We aim to bring you long-term focused analysis driven by fundamental data. Note that our analysis may not factor in the latest price-sensitive company announcements or qualitative material. Simply Wall St has no position in any stocks mentioned.
*Interactive Brokers Rated Lowest Cost Broker by StockBrokers.com Annual Online Review 2020
Have feedback on this article? Concerned about the content? Get in touch with us directly. Alternatively, email editorial-team@simplywallst.com.
Market Insights

Weekly Picks

Early mover in a fast growing industry. Likely to experience share price volatility as they scale


A case for CA$31.80 (undiluted), aka 8,616% upside from CA$0.37 (an 86 bagger!).


Moderation and Stabilisation: HOLD: Fair Price based on a 4-year Cycle is $12.08
Recently Updated Narratives

Meta’s Bold Bet on AI Pays Off

ADP Stock: Solid Fundamentals, But AI Investments Test Its Margin Resilience

Visa Stock: The Toll Booth at the Center of Global Commerce
Popular Narratives


Crazy Undervalued 42 Baggers Silver Play (Active & Running Mine)


NVDA: Expanding AI Demand Will Drive Major Data Center Investments Through 2026

The AI Infrastructure Giant Grows Into Its Valuation
Trending Discussion


