Advertisement
- United States
- /
- Commercial Services
- /
- NasdaqGS:TILE
Is Interface, Inc.'s (NASDAQ:TILE) Recent Stock Performance Influenced By Its Fundamentals In Any Way?
Interface (NASDAQ:TILE) has had a great run on the share market with its stock up by a significant 23% over the last three months. Given that stock prices are usually aligned with a company's financial performance in the long-term, we decided to study its financial indicators more closely to see if they had a hand to play in the recent price move. Specifically, we decided to study Interface's ROE in this article.
Return on equity or ROE is a key measure used to assess how efficiently a company's management is utilizing the company's capital. In other words, it is a profitability ratio which measures the rate of return on the capital provided by the company's shareholders.
View our latest analysis for Interface
How Is ROE Calculated?
ROE can be calculated by using the formula:
Return on Equity = Net Profit (from continuing operations) ÷ Shareholders' Equity
So, based on the above formula, the ROE for Interface is:
10% = US$45m ÷ US$426m (Based on the trailing twelve months to December 2023).
The 'return' is the yearly profit. That means that for every $1 worth of shareholders' equity, the company generated $0.10 in profit.
What Is The Relationship Between ROE And Earnings Growth?
So far, we've learned that ROE is a measure of a company's profitability. Based on how much of its profits the company chooses to reinvest or "retain", we are then able to evaluate a company's future ability to generate profits. Generally speaking, other things being equal, firms with a high return on equity and profit retention, have a higher growth rate than firms that don’t share these attributes.
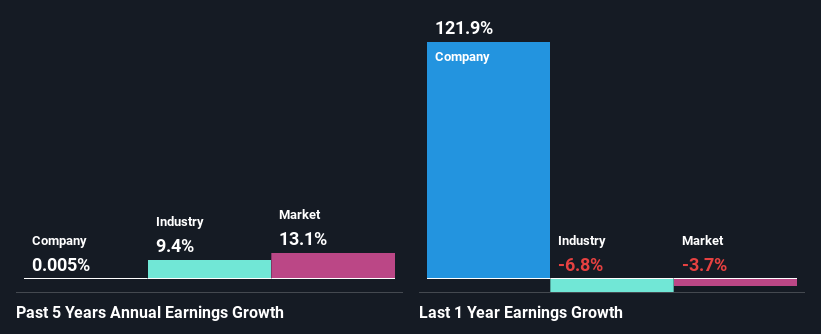
Interface's Earnings Growth And 10% ROE
To begin with, Interface seems to have a respectable ROE. Even when compared to the industry average of 11% the company's ROE looks quite decent. However, we are curious as to how Interface's decent returns still resulted in flat growth for Interface in the past five years. Based on this, we feel that there might be other reasons which haven't been discussed so far in this article that could be hampering the company's growth. These include low earnings retention or poor allocation of capital.
Next, on comparing with the industry net income growth, we found that Interface's reported growth was lower than the industry growth of 9.4% over the last few years, which is not something we like to see.
Earnings growth is a huge factor in stock valuation. It’s important for an investor to know whether the market has priced in the company's expected earnings growth (or decline). This then helps them determine if the stock is placed for a bright or bleak future. Is Interface fairly valued compared to other companies? These 3 valuation measures might help you decide.
Is Interface Using Its Retained Earnings Effectively?
Interface has a low three-year median payout ratio of 4.9% (or a retention ratio of 95%) but the negligible earnings growth number doesn't reflect this as high growth usually follows high profit retention.
Additionally, Interface has paid dividends over a period of at least ten years, which means that the company's management is determined to pay dividends even if it means little to no earnings growth. Our latest analyst data shows that the future payout ratio of the company over the next three years is expected to be approximately 5.6%.
Summary
In total, it does look like Interface has some positive aspects to its business. Although, we are disappointed to see a lack of growth in earnings even in spite of a high ROE and and a high reinvestment rate. We believe that there might be some outside factors that could be having a negative impact on the business. With that said, the latest industry analyst forecasts reveal that the company's earnings are expected to accelerate. To know more about the company's future earnings growth forecasts take a look at this free report on analyst forecasts for the company to find out more.
New: AI Stock Screener & Alerts
Our new AI Stock Screener scans the market every day to uncover opportunities.
• Dividend Powerhouses (3%+ Yield)
• Undervalued Small Caps with Insider Buying
• High growth Tech and AI Companies
Or build your own from over 50 metrics.
Have feedback on this article? Concerned about the content? Get in touch with us directly. Alternatively, email editorial-team (at) simplywallst.com.
This article by Simply Wall St is general in nature. We provide commentary based on historical data and analyst forecasts only using an unbiased methodology and our articles are not intended to be financial advice. It does not constitute a recommendation to buy or sell any stock, and does not take account of your objectives, or your financial situation. We aim to bring you long-term focused analysis driven by fundamental data. Note that our analysis may not factor in the latest price-sensitive company announcements or qualitative material. Simply Wall St has no position in any stocks mentioned.
About NasdaqGS:TILE
Interface
Designs, produces, and sells modular carpet products in the United States, Canada, Latin America, Europe, Africa, Asia, and Australia.
Flawless balance sheet with solid track record.
Similar Companies
Market Insights


Advertisement
Weekly Picks
CE


Ceazar on Sparc AI ·
When GPS fails: this small cap is fixing a $54B drone problem
Fair Value:CA$5.2552.0% undervalued
120 followersusers have followed this narrative
0 commentsusers have commented on this narrative
25 likesusers have liked this narrative
BL


BlackGoat on IREN ·
IREN's Bold Moves in Sustainable Bitcoin Mining & AI Data Centers
Fair Value:US$71.4848.5% undervalued
222 followersusers have followed this narrative
9 commentsusers have commented on this narrative
33 likesusers have liked this narrative
HE


HedgeY on Arm Holdings ·
The Architecture Layer of AI Computing - But Priced Like the Future Already Arrived?
Fair Value:US$43044.3% undervalued
23 followersusers have followed this narrative
1 commentusers have commented on this narrative
6 likesusers have liked this narrative
HI


Hidden_Rock_Capital on Fiserv ·
Temporary "perfect storm" leads to opportunity to buy financial services leader for less than 5x long-term earnings
Fair Value:US$119.9955.0% undervalued
31 followersusers have followed this narrative
1 commentusers have commented on this narrative
10 likesusers have liked this narrative
Recently Updated Narratives
AR

ariz_scribe on Marti Technologies ·
$MRT at Roth - Pick of the Panel
Fair Value:US$1.965.6% undervalued
7 followersusers have followed this narrative
0 commentsusers have commented on this narrative
0 likesusers have liked this narrative
TR


TripleS on Vistance Networks ·
VISN trades at $11.83 with roughly $1.88 billion of cash and zero debt after closing the sale of its Ruckus division to Belden on July 1
Fair Value:US$1626.6% undervalued
1 followerusers have followed this narrative
0 commentsusers have commented on this narrative
0 likesusers have liked this narrative
JO


John_Eric on Vertiv Holdings Co ·
Everyone's Favorite Stock Just Fell 17% in a Day. It Still Isn't Cheap.
Fair Value:US$21313.4% overvalued
2 followersusers have followed this narrative
0 commentsusers have commented on this narrative
0 likesusers have liked this narrative
Popular Narratives
OS


oscargarcia on NVIDIA ·
The company that went from selling GPUs to gamers to becoming the AI arms dealer of the 21st century.
Fair Value:US$28028.3% undervalued
221 followersusers have followed this narrative
9 commentsusers have commented on this narrative
15 likesusers have liked this narrative
CU

CubanEros on Microsoft ·
A wonderful business at reasonable price.
Fair Value:US$419.9110.7% overvalued
99 followersusers have followed this narrative
0 commentsusers have commented on this narrative
7 likesusers have liked this narrative
TR


tripledub on Alphabet ·
Warren Buffett Just Bet $10 Billion on Google. The Catch? You May Already Be Too Late.
Fair Value:US$23054.8% overvalued
116 followersusers have followed this narrative
1 commentusers have commented on this narrative
18 likesusers have liked this narrative
Trending Discussion
GR
greg_xasak on Fiserv ·
As someone who has dealt directly with them as a CTO for a credit union, I have 8 years of horror stories about doing business with them. If there was any other competitor than could deliver 80% of Fiserv services, there would be a mad rush to migrate to them. They should thank their lucky stars they are a near monopoly. this industry is so ripe for a well funded competitor. Their integration of technology is awful, their ability to fix their own implementation screwups is sadly tragic. Sometimes they just silently kill support tickets without resolution and you never find out until you do a follow up inquiry. Why, because sometimes no one you are dealing with knows how to fix it and knows no one to ask for help. They can not meet their own implementation deadlines and sometimes there is no one on a technical team dealing with you that has any banking or credit union experience. The is an industry insider phrase when you meet other Fiserv customers called being "Fiserved". It means telling others of your worst stories of dealing with them. Ask around, all CTO's have some doozies.
1
|0

BL

Blegells on Terra Balcanica Resources ·
⏫42X THE AVERAGE DAILY TRADING VOLUME TODAY, JULY 28 🐂🐂🐂 FORTY-TWO!
1
|0