Advertisement
- United States
- /
- Commercial Services
- /
- NasdaqGS:TILE
Interface's (NASDAQ:TILE) Returns Have Hit A Wall
If you're not sure where to start when looking for the next multi-bagger, there are a few key trends you should keep an eye out for. Ideally, a business will show two trends; firstly a growing return on capital employed (ROCE) and secondly, an increasing amount of capital employed. Basically this means that a company has profitable initiatives that it can continue to reinvest in, which is a trait of a compounding machine. In light of that, when we looked at Interface (NASDAQ:TILE) and its ROCE trend, we weren't exactly thrilled.
Understanding Return On Capital Employed (ROCE)
If you haven't worked with ROCE before, it measures the 'return' (pre-tax profit) a company generates from capital employed in its business. The formula for this calculation on Interface is:
Return on Capital Employed = Earnings Before Interest and Tax (EBIT) ÷ (Total Assets - Current Liabilities)
0.14 = US$137m ÷ (US$1.2b - US$236m) (Based on the trailing twelve months to September 2024).
Thus, Interface has an ROCE of 14%. In absolute terms, that's a satisfactory return, but compared to the Commercial Services industry average of 11% it's much better.
See our latest analysis for Interface
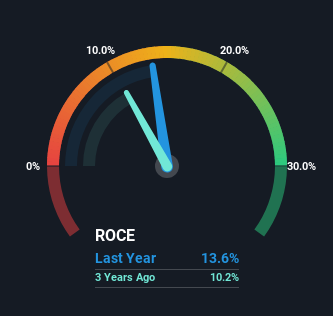
Above you can see how the current ROCE for Interface compares to its prior returns on capital, but there's only so much you can tell from the past. If you'd like, you can check out the forecasts from the analysts covering Interface for free.
What The Trend Of ROCE Can Tell Us
There hasn't been much to report for Interface's returns and its level of capital employed because both metrics have been steady for the past five years. It's not uncommon to see this when looking at a mature and stable business that isn't re-investing its earnings because it has likely passed that phase of the business cycle. So unless we see a substantial change at Interface in terms of ROCE and additional investments being made, we wouldn't hold our breath on it being a multi-bagger.
What We Can Learn From Interface's ROCE
In a nutshell, Interface has been trudging along with the same returns from the same amount of capital over the last five years. Although the market must be expecting these trends to improve because the stock has gained 48% over the last five years. Ultimately, if the underlying trends persist, we wouldn't hold our breath on it being a multi-bagger going forward.
One more thing to note, we've identified 2 warning signs with Interface and understanding these should be part of your investment process.
If you want to search for solid companies with great earnings, check out this free list of companies with good balance sheets and impressive returns on equity.
New: AI Stock Screener & Alerts
Our new AI Stock Screener scans the market every day to uncover opportunities.
• Dividend Powerhouses (3%+ Yield)
• Undervalued Small Caps with Insider Buying
• High growth Tech and AI Companies
Or build your own from over 50 metrics.
Have feedback on this article? Concerned about the content? Get in touch with us directly. Alternatively, email editorial-team (at) simplywallst.com.
This article by Simply Wall St is general in nature. We provide commentary based on historical data and analyst forecasts only using an unbiased methodology and our articles are not intended to be financial advice. It does not constitute a recommendation to buy or sell any stock, and does not take account of your objectives, or your financial situation. We aim to bring you long-term focused analysis driven by fundamental data. Note that our analysis may not factor in the latest price-sensitive company announcements or qualitative material. Simply Wall St has no position in any stocks mentioned.
About NasdaqGS:TILE
Interface
Designs, produces, and sells modular carpet products in the United States, Canada, Latin America, Europe, Africa, Asia, and Australia.
Flawless balance sheet with solid track record.
Similar Companies
Market Insights


Advertisement
Weekly Picks
DA


davidlsander on Nevgold ·
The U.S. Government Is Desperate for This Metal. This Tiny Miner Has It -- Its Closest Peer Is Already Worth Double.
Fair Value:US$2.1941.1% undervalued
19 followersusers have followed this narrative
0 commentsusers have commented on this narrative
2 likesusers have liked this narrative
BE

benjamin_lvieq on PayPal Holdings ·
PayPal: PayPal Doesn't Need to Grow – It Needs to Stop Falling – A Mispriced Cash Machine With a Cannibal Buyback
Fair Value:US$6514.6% undervalued
50 followersusers have followed this narrative
2 commentsusers have commented on this narrative
9 likesusers have liked this narrative
JD

JD009 on Celsius Holdings ·
From $5M to $2B: Why the 2024 Crash Was the Best Buying Opportunity in Consumer Stocks
Fair Value:US$55.4345.5% undervalued
16 followersusers have followed this narrative
1 commentusers have commented on this narrative
8 likesusers have liked this narrative
WA

Wavefarer on Accenture ·
High-quality global services company facing an AI-driven valuation reset.
Fair Value:US$30154.5% undervalued
15 followersusers have followed this narrative
0 commentsusers have commented on this narrative
4 likesusers have liked this narrative
Recently Updated Narratives
AG


Agricola on Silver Storm Mining ·
A case for USD $26.00 (CAD 36.00) by 2030 with a MKT CAP of CAD$8.40 billion (USD$6.10) (10 bagger by Dec 2027)
Fair Value:CA$3698.8% undervalued
10 followersusers have followed this narrative
0 commentsusers have commented on this narrative
0 likesusers have liked this narrative
AG

Agricola on First Mining Gold ·
First Mining Gold's competitive advantages in the mining sector.
Fair Value:CA$587.4% undervalued
23 followersusers have followed this narrative
4 commentsusers have commented on this narrative
0 likesusers have liked this narrative
AG

Agricola on Central Asia Metals ·
A Case for Central Asia Metals to reach £8-12 by 2031 in a commodities bull market.
Fair Value:UK£1288.6% undervalued
2 followersusers have followed this narrative
2 commentsusers have commented on this narrative
0 likesusers have liked this narrative
Popular Narratives
IN


Investingwilly on Mastercard ·
Mastercard: The Best Dividend Stock You're Ignoring
Fair Value:US$75028.6% undervalued
92 followersusers have followed this narrative
1 commentusers have commented on this narrative
9 likesusers have liked this narrative
BL


BlackGoat on Cerebras Systems ·
The Wafer Giant Threatening NVIDIA's GPU Hegemony
Fair Value:US$415.5455.7% undervalued
63 followersusers have followed this narrative
3 commentsusers have commented on this narrative
11 likesusers have liked this narrative
CE


Ceazar on Conexeu Sciences ·
This small biotech is developing technology that could potentially change how tissue is rebuilt
Fair Value:US$25.3455.9% undervalued
60 followersusers have followed this narrative
0 commentsusers have commented on this narrative
9 likesusers have liked this narrative
Trending Discussion
BE
benjamin_lvieq on PayPal Holdings ·
An investment case is not about loving the product. Its about price vs reality.
1
|0
