Stock Analysis
- United States
- /
- Professional Services
- /
- NasdaqGS:SAIC
Science Applications International's (NASDAQ:SAIC) 15% CAGR outpaced the company's earnings growth over the same five-year period


These days it's easy to simply buy an index fund, and your returns should (roughly) match the market. But you can do a lot better than that by buying good quality businesses for attractive prices. For example, the Science Applications International Corporation (NASDAQ:SAIC) share price is up 82% in the last five years, slightly above the market return. It's fair to say the stock has continued its long term trend in the last year, over which it has risen 35%.
The past week has proven to be lucrative for Science Applications International investors, so let's see if fundamentals drove the company's five-year performance.
Check out our latest analysis for Science Applications International
To paraphrase Benjamin Graham: Over the short term the market is a voting machine, but over the long term it's a weighing machine. One flawed but reasonable way to assess how sentiment around a company has changed is to compare the earnings per share (EPS) with the share price.
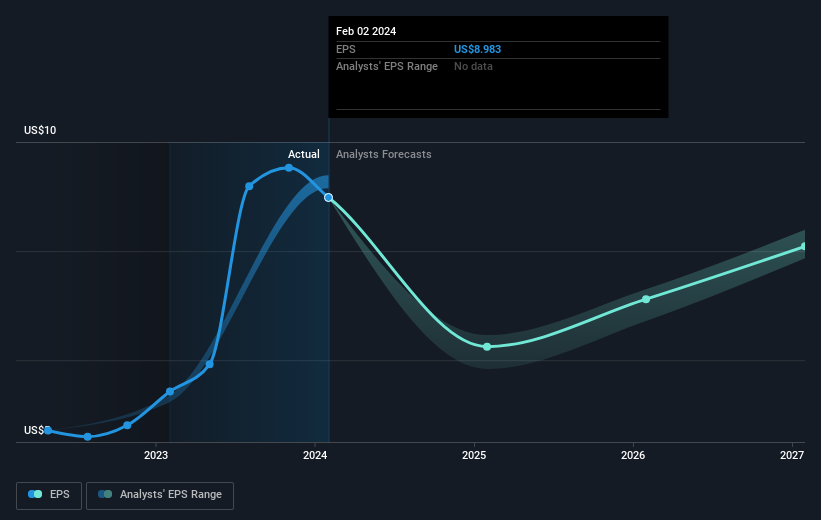
During five years of share price growth, Science Applications International achieved compound earnings per share (EPS) growth of 24% per year. The EPS growth is more impressive than the yearly share price gain of 13% over the same period. So one could conclude that the broader market has become more cautious towards the stock.
You can see below how EPS has changed over time (discover the exact values by clicking on the image).
It's probably worth noting we've seen significant insider buying in the last quarter, which we consider a positive. On the other hand, we think the revenue and earnings trends are much more meaningful measures of the business. Dive deeper into the earnings by checking this interactive graph of Science Applications International's earnings, revenue and cash flow.
What About Dividends?
It is important to consider the total shareholder return, as well as the share price return, for any given stock. The TSR is a return calculation that accounts for the value of cash dividends (assuming that any dividend received was reinvested) and the calculated value of any discounted capital raisings and spin-offs. Arguably, the TSR gives a more comprehensive picture of the return generated by a stock. In the case of Science Applications International, it has a TSR of 97% for the last 5 years. That exceeds its share price return that we previously mentioned. This is largely a result of its dividend payments!
A Different Perspective
We're pleased to report that Science Applications International shareholders have received a total shareholder return of 37% over one year. And that does include the dividend. That gain is better than the annual TSR over five years, which is 15%. Therefore it seems like sentiment around the company has been positive lately. Given the share price momentum remains strong, it might be worth taking a closer look at the stock, lest you miss an opportunity. It's always interesting to track share price performance over the longer term. But to understand Science Applications International better, we need to consider many other factors. To that end, you should learn about the 3 warning signs we've spotted with Science Applications International (including 2 which are concerning) .
Science Applications International is not the only stock that insiders are buying. For those who like to find winning investments this free list of growing companies with recent insider purchasing, could be just the ticket.
Please note, the market returns quoted in this article reflect the market weighted average returns of stocks that currently trade on American exchanges.
Valuation is complex, but we're helping make it simple.
Find out whether Science Applications International is potentially over or undervalued by checking out our comprehensive analysis, which includes fair value estimates, risks and warnings, dividends, insider transactions and financial health.
View the Free AnalysisHave feedback on this article? Concerned about the content? Get in touch with us directly. Alternatively, email editorial-team (at) simplywallst.com.
This article by Simply Wall St is general in nature. We provide commentary based on historical data and analyst forecasts only using an unbiased methodology and our articles are not intended to be financial advice. It does not constitute a recommendation to buy or sell any stock, and does not take account of your objectives, or your financial situation. We aim to bring you long-term focused analysis driven by fundamental data. Note that our analysis may not factor in the latest price-sensitive company announcements or qualitative material. Simply Wall St has no position in any stocks mentioned.
About NasdaqGS:SAIC
Science Applications International
Provides technical, engineering, and enterprise information technology (IT) services primarily in the United States.
Undervalued with proven track record and pays a dividend.

