- United States
- /
- Healthcare Services
- /
- NasdaqGS:PHLT
These Return Metrics Don't Make Performant Financial (NASDAQ:PFMT) Look Too Strong

To avoid investing in a business that's in decline, there's a few financial metrics that can provide early indications of aging. A business that's potentially in decline often shows two trends, a return on capital employed (ROCE) that's declining, and a base of capital employed that's also declining. This combination can tell you that not only is the company investing less, it's earning less on what it does invest. Having said that, after a brief look, Performant Financial (NASDAQ:PFMT) we aren't filled with optimism, but let's investigate further.
Understanding Return On Capital Employed (ROCE)
For those who don't know, ROCE is a measure of a company's yearly pre-tax profit (its return), relative to the capital employed in the business. To calculate this metric for Performant Financial, this is the formula:
Return on Capital Employed = Earnings Before Interest and Tax (EBIT) ÷ (Total Assets - Current Liabilities)
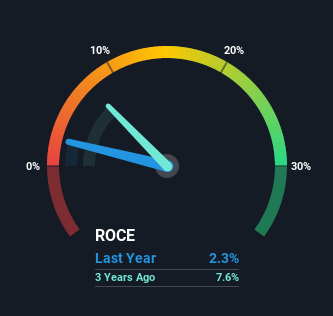
0.023 = US$2.1m ÷ (US$151m - US$61m) (Based on the trailing twelve months to September 2021).
Therefore, Performant Financial has an ROCE of 2.3%. Ultimately, that's a low return and it under-performs the Commercial Services industry average of 8.6%.
See our latest analysis for Performant Financial
Above you can see how the current ROCE for Performant Financial compares to its prior returns on capital, but there's only so much you can tell from the past. If you're interested, you can view the analysts predictions in our free report on analyst forecasts for the company.
What The Trend Of ROCE Can Tell Us
We are a bit anxious about the trends of ROCE at Performant Financial. The company used to generate 9.5% on its capital five years ago but it has since fallen noticeably. What's equally concerning is that the amount of capital deployed in the business has shrunk by 43% over that same period. When you see both ROCE and capital employed diminishing, it can often be a sign of a mature and shrinking business that might be in structural decline. If these underlying trends continue, we wouldn't be too optimistic going forward.
While on the subject, we noticed that the ratio of current liabilities to total assets has risen to 41%, which has impacted the ROCE. Without this increase, it's likely that ROCE would be even lower than 2.3%. And with current liabilities at these levels, suppliers or short-term creditors are effectively funding a large part of the business, which can introduce some risks.
Our Take On Performant Financial's ROCE
In summary, it's unfortunate that Performant Financial is shrinking its capital base and also generating lower returns. And long term shareholders have watched their investments stay flat over the last five years. With underlying trends that aren't great in these areas, we'd consider looking elsewhere.
Like most companies, Performant Financial does come with some risks, and we've found 2 warning signs that you should be aware of.
If you want to search for solid companies with great earnings, check out this free list of companies with good balance sheets and impressive returns on equity.
The New Payments ETF Is Live on NASDAQ:
Money is moving to real-time rails, and a newly listed ETF now gives investors direct exposure. Fast settlement. Institutional custody. Simple access.
Explore how this launch could reshape portfolios
Sponsored ContentNew: Manage All Your Stock Portfolios in One Place
We've created the ultimate portfolio companion for stock investors, and it's free.
• Connect an unlimited number of Portfolios and see your total in one currency
• Be alerted to new Warning Signs or Risks via email or mobile
• Track the Fair Value of your stocks
Have feedback on this article? Concerned about the content? Get in touch with us directly. Alternatively, email editorial-team (at) simplywallst.com.
This article by Simply Wall St is general in nature. We provide commentary based on historical data and analyst forecasts only using an unbiased methodology and our articles are not intended to be financial advice. It does not constitute a recommendation to buy or sell any stock, and does not take account of your objectives, or your financial situation. We aim to bring you long-term focused analysis driven by fundamental data. Note that our analysis may not factor in the latest price-sensitive company announcements or qualitative material. Simply Wall St has no position in any stocks mentioned.
About NasdaqGS:PHLT
Performant Healthcare
Provides audit, recovery, and analytics services in the United States.
Excellent balance sheet with moderate growth potential.
Similar Companies
Market Insights

Weekly Picks

Early mover in a fast growing industry. Likely to experience share price volatility as they scale


A case for CA$31.80 (undiluted), aka 8,616% upside from CA$0.37 (an 86 bagger!).


Moderation and Stabilisation: HOLD: Fair Price based on a 4-year Cycle is $12.08
Recently Updated Narratives


Q3 Outlook modestly optimistic


Title: Market Sentiment Is Dead Wrong — Here's Why PSEC Deserves a Second Look


An amazing opportunity to potentially get a 100 bagger
Popular Narratives


Crazy Undervalued 42 Baggers Silver Play (Active & Running Mine)


NVDA: Expanding AI Demand Will Drive Major Data Center Investments Through 2026


MicroVision will explode future revenue by 380.37% with a vision towards success
Trending Discussion
