Stock Analysis
- United States
- /
- Machinery
- /
- NYSE:REVG
Is REV Group, Inc.'s (NYSE:REVG) Stock's Recent Performance Being Led By Its Attractive Financial Prospects?


REV Group (NYSE:REVG) has had a great run on the share market with its stock up by a significant 36% over the last three months. Given that the market rewards strong financials in the long-term, we wonder if that is the case in this instance. Particularly, we will be paying attention to REV Group's ROE today.
Return on equity or ROE is a key measure used to assess how efficiently a company's management is utilizing the company's capital. Put another way, it reveals the company's success at turning shareholder investments into profits.
See our latest analysis for REV Group
How To Calculate Return On Equity?
ROE can be calculated by using the formula:
Return on Equity = Net Profit (from continuing operations) ÷ Shareholders' Equity
So, based on the above formula, the ROE for REV Group is:
49% = US$242m ÷ US$496m (Based on the trailing twelve months to January 2024).
The 'return' is the yearly profit. That means that for every $1 worth of shareholders' equity, the company generated $0.49 in profit.
What Has ROE Got To Do With Earnings Growth?
Thus far, we have learned that ROE measures how efficiently a company is generating its profits. We now need to evaluate how much profit the company reinvests or "retains" for future growth which then gives us an idea about the growth potential of the company. Assuming everything else remains unchanged, the higher the ROE and profit retention, the higher the growth rate of a company compared to companies that don't necessarily bear these characteristics.
REV Group's Earnings Growth And 49% ROE
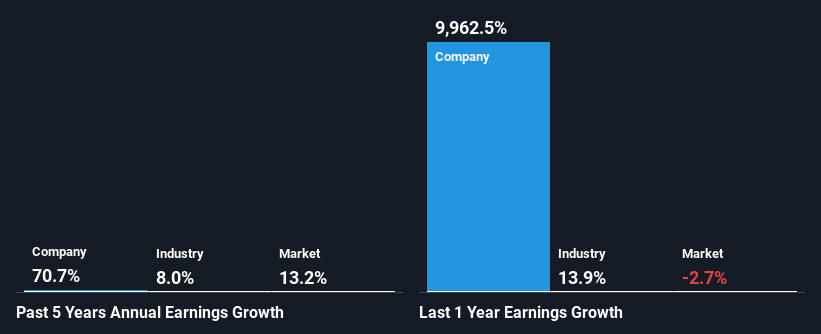
First thing first, we like that REV Group has an impressive ROE. Secondly, even when compared to the industry average of 14% the company's ROE is quite impressive. As a result, REV Group's exceptional 71% net income growth seen over the past five years, doesn't come as a surprise.
Next, on comparing with the industry net income growth, we found that REV Group's growth is quite high when compared to the industry average growth of 8.0% in the same period, which is great to see.
The basis for attaching value to a company is, to a great extent, tied to its earnings growth. The investor should try to establish if the expected growth or decline in earnings, whichever the case may be, is priced in. By doing so, they will have an idea if the stock is headed into clear blue waters or if swampy waters await. Is REV Group fairly valued compared to other companies? These 3 valuation measures might help you decide.
Is REV Group Efficiently Re-investing Its Profits?
REV Group has a three-year median payout ratio of 47% (where it is retaining 53% of its income) which is not too low or not too high. This suggests that its dividend is well covered, and given the high growth we discussed above, it looks like REV Group is reinvesting its earnings efficiently.
Additionally, REV Group has paid dividends over a period of seven years which means that the company is pretty serious about sharing its profits with shareholders. Upon studying the latest analysts' consensus data, we found that the company's future payout ratio is expected to drop to 9.8% over the next three years.
Conclusion
On the whole, we feel that REV Group's performance has been quite good. Specifically, we like that the company is reinvesting a huge chunk of its profits at a high rate of return. This of course has caused the company to see substantial growth in its earnings. That being so, according to the latest industry analyst forecasts, the company's earnings are expected to shrink in the future. Are these analysts expectations based on the broad expectations for the industry, or on the company's fundamentals? Click here to be taken to our analyst's forecasts page for the company.
Valuation is complex, but we're helping make it simple.
Find out whether REV Group is potentially over or undervalued by checking out our comprehensive analysis, which includes fair value estimates, risks and warnings, dividends, insider transactions and financial health.
View the Free AnalysisHave feedback on this article? Concerned about the content? Get in touch with us directly. Alternatively, email editorial-team (at) simplywallst.com.
This article by Simply Wall St is general in nature. We provide commentary based on historical data and analyst forecasts only using an unbiased methodology and our articles are not intended to be financial advice. It does not constitute a recommendation to buy or sell any stock, and does not take account of your objectives, or your financial situation. We aim to bring you long-term focused analysis driven by fundamental data. Note that our analysis may not factor in the latest price-sensitive company announcements or qualitative material. Simply Wall St has no position in any stocks mentioned.
About NYSE:REVG
REV Group
Designs, manufactures, and distributes specialty vehicles, and related aftermarket parts and services in the United States, Canada, and internationally.
Solid track record with excellent balance sheet.
