Advertisement
- United States
- /
- Trade Distributors
- /
- NYSE:QXO
Does QXO’s Recent Leadership Shakeup Signal a Revaluation Opportunity for 2025?

Simply Wall St
Reviewed by Bailey Pemberton
If you have been tracking QXO, you probably aren’t alone in wondering whether it is time to buy, hold, or look elsewhere. In the fast-moving world of stocks, QXO has seen a mix of short-run dips and longer-term resilience that have sparked a lot of debate about its real value. After rallying for most of the year, the stock has pulled back by 4.8% over the past week and 3.8% in the last month. Still, when you zoom out, QXO’s shares are up a healthy 17.6% year-to-date and 16.6% over the past year. Those numbers would catch anyone’s eye, especially against a challenging market backdrop.
Some of the movement appears to connect back to fresh developments in the company’s approach to digital transformation and a recently announced leadership shakeup. Investors seem to be rethinking the long-term potential here, as the company’s five-year record shows a solid 24.1% gain, even though the three-year return still lags at minus 34.7%. These numbers hint at changing perceptions of risk and growth, which is exactly why so many are revisiting their stance on QXO right now.
If you are focused on value, QXO’s current value score sits at 2 out of 6, so the company screens as undervalued in only two of six main checks. But numbers alone don’t tell the whole story. Up next, we will look at the main ways analysts and investors measure whether a company is undervalued or overvalued, and explore why some valuation methods might actually miss the mark entirely.
QXO scores just 2/6 on our valuation checks. See what other red flags we found in the full valuation breakdown.
Approach 1: QXO Discounted Cash Flow (DCF) Analysis
The Discounted Cash Flow (DCF) model estimates a company’s value by projecting its future free cash flows, then discounting those projections back to today’s dollar value. This approach helps investors understand what QXO could be worth, based on how much actual cash it is expected to generate over time.
Currently, QXO’s last twelve months of Free Cash Flow stands at -$72.08 Million in USD. Analysts expect this to turn markedly positive over the next several years, reaching $1.40 Billion by the end of 2029. Looking further ahead, projections suggest QXO could generate more than $2.44 Billion in Free Cash Flow by 2035. It is important to note that estimates beyond 2029 are extrapolated and not based on analyst consensus.
After discounting all these future cash flows using a 2 Stage Free Cash Flow to Equity model, the DCF calculation puts QXO’s intrinsic value at $43.70 per share. Compared to today's share price, this implies the stock is trading at a 58.6% discount to its DCF-derived value. From a pure cash flow perspective, QXO appears attractively undervalued at current levels.
Result: UNDERVALUED
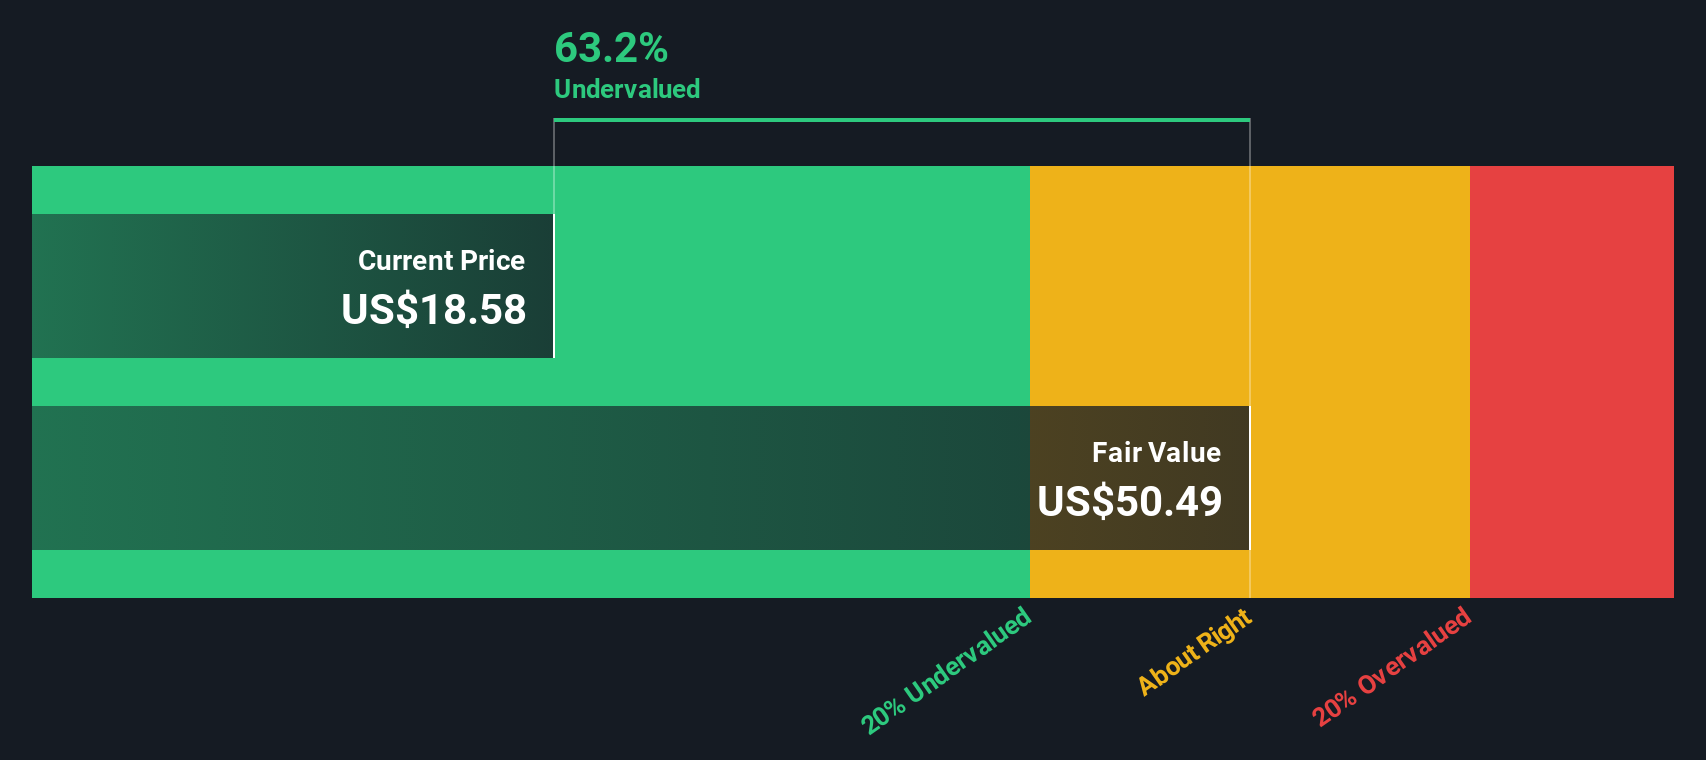
Our Discounted Cash Flow (DCF) analysis suggests QXO is undervalued by 58.6%. Track this in your watchlist or portfolio, or discover more undervalued stocks.
Approach 2: QXO Price vs Sales (P/S)
When analyzing companies that are unprofitable or have volatile earnings, the Price-to-Sales (P/S) ratio often becomes the preferred valuation metric. This ratio gives a clearer picture of a company's value relative to its actual revenue, making it especially useful for growth-oriented companies where profits may be inconsistent or negative.
What counts as a “normal” or “fair” P/S ratio depends on several factors, including expected revenue growth, profit margins, underlying business risks, and how the broader market values similar companies. Higher growth and lower risk typically justify a higher ratio, while stagnant growth or more risk lead to a lower benchmark.
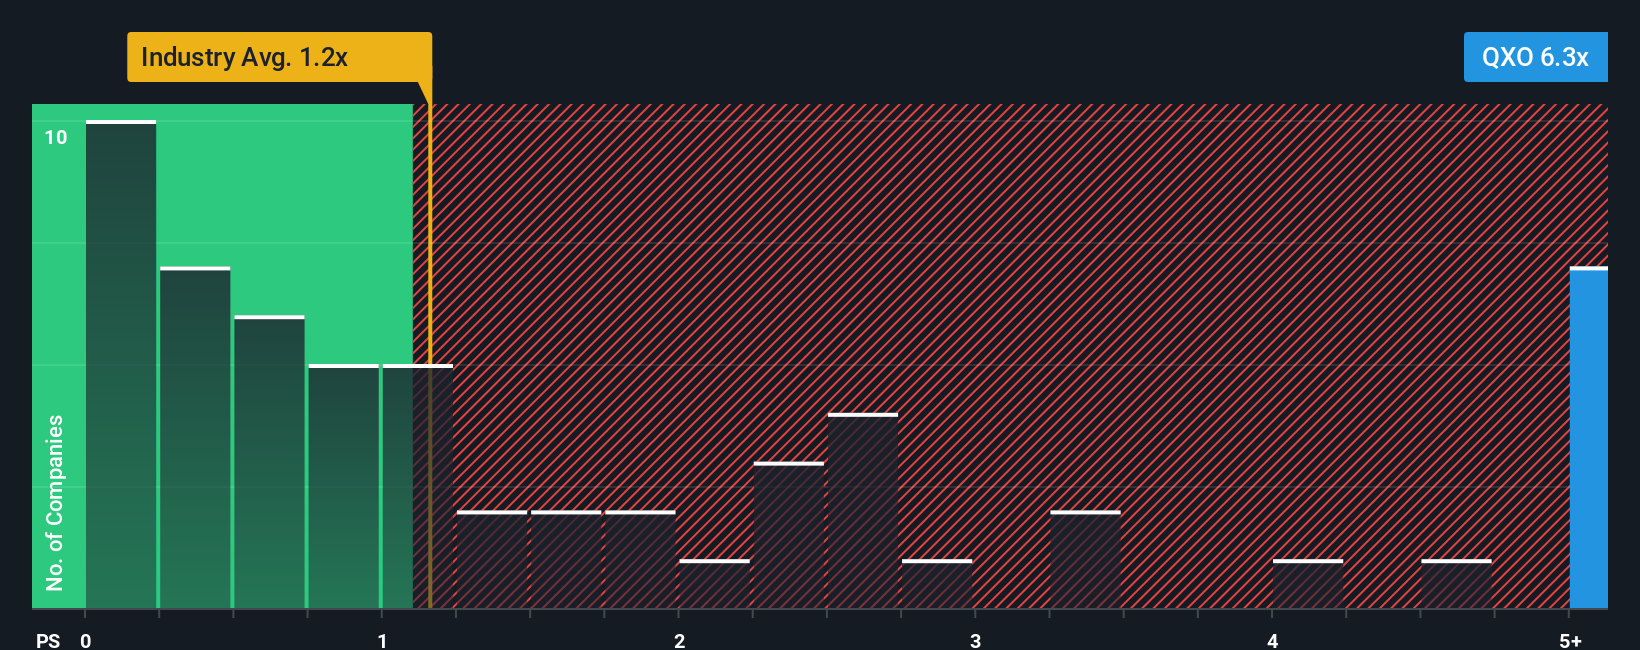
For QXO, the current P/S ratio is 6.25x. This is significantly above the Trade Distributors industry average of 1.15x and also higher than the peer group average of 3.13x. However, raw comparisons like these do not always capture the full context of a company’s future growth prospects or business risks.
This is where Simply Wall St’s “Fair Ratio” comes in. The Fair Ratio for QXO, calculated based on factors such as the company’s revenue growth, profit margin, risk profile, industry, and market capitalization, is 5.62x. Unlike a simple industry or peer comparison, the Fair Ratio incorporates the nuances that matter most to investors and creates a much more tailored and insightful benchmark for valuation.
Since QXO’s P/S ratio of 6.25x is moderately above its Fair Ratio of 5.62x and the difference is greater than the 0.10 threshold, this points to the stock being a bit overvalued on a sales basis, given its current fundamentals and outlook.
Result: OVERVALUED
PS ratios tell one story, but what if the real opportunity lies elsewhere? Discover companies where insiders are betting big on explosive growth.
Upgrade Your Decision Making: Choose your QXO Narrative
Earlier we mentioned that there is an even better way to understand valuation, so let us introduce you to Narratives. A Narrative is simply your story for a company, turning your insights and beliefs about QXO’s future into concrete forecasts of revenue, earnings, margins, and ultimately an estimated fair value.
Instead of just crunching numbers, Narratives help you link the company’s journey to real financial forecasts and then compare your own fair value to the current market price. This flexible, powerful tool is easy to use and is already being used by millions of investors on Simply Wall St’s Community page.
With Narratives, you can quickly see if your view of QXO prompts a buy, sell, or hold decision. As news or company results come in, your Narrative is dynamically updated to reflect new information. This keeps your analysis current.
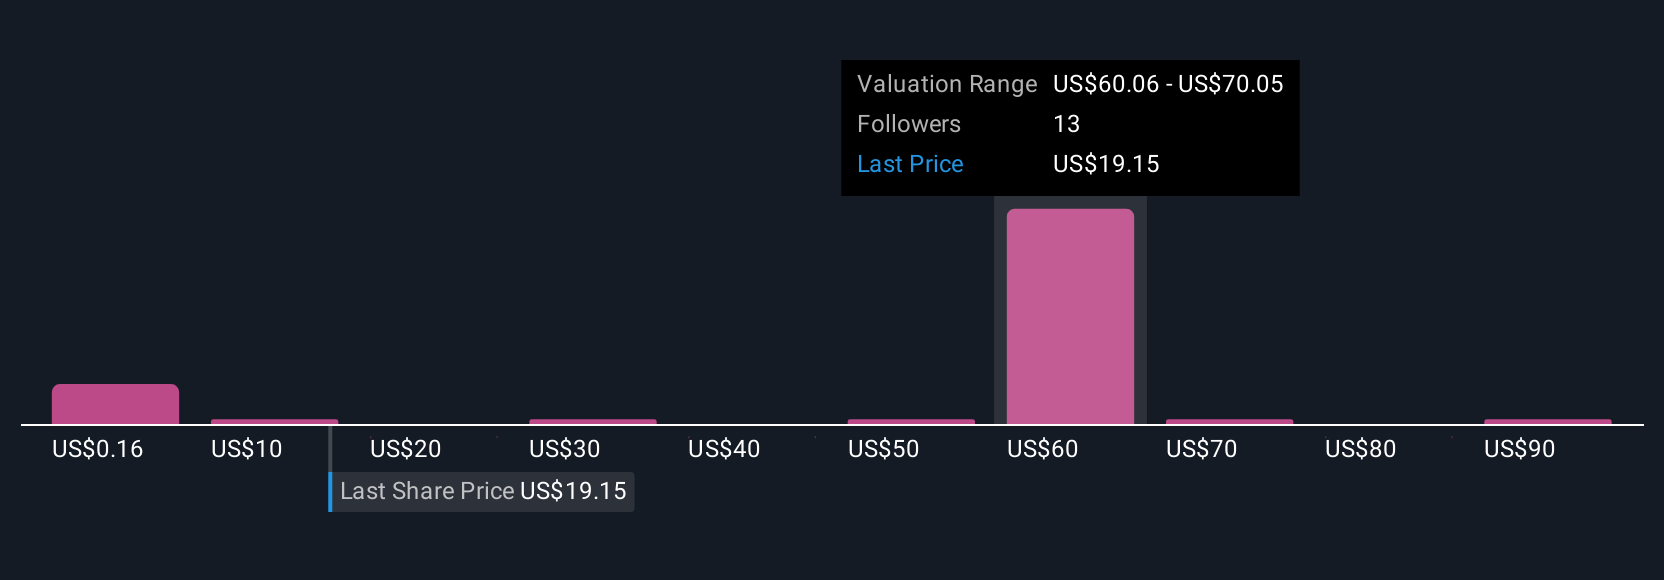
For example, one investor may see QXO’s fair value as high as $60, believing in rapid growth, while another may see it as low as $30 based on more cautious assumptions. Narratives make it easy to visualize these perspectives, empowering you to make decisions that truly fit your outlook.
Do you think there's more to the story for QXO? Create your own Narrative to let the Community know!
This article by Simply Wall St is general in nature. We provide commentary based on historical data and analyst forecasts only using an unbiased methodology and our articles are not intended to be financial advice. It does not constitute a recommendation to buy or sell any stock, and does not take account of your objectives, or your financial situation. We aim to bring you long-term focused analysis driven by fundamental data. Note that our analysis may not factor in the latest price-sensitive company announcements or qualitative material. Simply Wall St has no position in any stocks mentioned.
Valuation is complex, but we're here to simplify it.
Discover if QXO might be undervalued or overvalued with our detailed analysis, featuring fair value estimates, potential risks, dividends, insider trades, and its financial condition.
Access Free AnalysisHave feedback on this article? Concerned about the content? Get in touch with us directly. Alternatively, email editorial-team@simplywallst.com
About NYSE:QXO
QXO
Distributes roofing, waterproofing, and other building products in the United States.
High growth potential with adequate balance sheet.
Market Insights

Advertisement
Community Narratives
Finding The True Value Of A Logistics Powerhouse
Fair Value US$95.21|6.3% undervalued
NV
Community Contributor
Paradigm Biopharmaceuticals Will Lead Osteoarthritis Treatment with Zilosul's FDA Success
Fair Value AU$5.50|91.9% undervalued
AM
Community Contributor
Barrick Mining (ABX:CA): A Gold Hedge against a U.S. Shutdown
Fair Value CA$60.00|25.8% undervalued
GM
Community Contributor