Advertisement
- United States
- /
- Machinery
- /
- NYSE:GTLS
Evaluating Chart Industries After Major Hydrogen Expansion and 41% Share Price Surge

Simply Wall St
Reviewed by Bailey Pemberton
- Wondering if Chart Industries is a hidden gem or already fairly priced? You are not alone. There are plenty of signals worth digging into today.
- Despite a modest dip of 0.1% over the past week and 0.6% over the last month, Chart Industries has delivered an impressive 41.0% return for shareholders over the last year and a remarkable 119.1% return over five years, signaling strong long-term potential.
- Momentum around the stock has followed several notable deals in the industrial gas and energy solutions space. Chart Industries has made headlines for expanding its hydrogen and energy transition portfolio. The company has also attracted positive attention with new partnerships aimed at decarbonization and infrastructure growth, adding fuel to investor interest and recent price movements.
- The current valuation score for Chart Industries is 4 out of 6, based on how many ways the company appears undervalued against market checks. Next, we will dig into these valuation approaches and, by the end of the article, explore an even smarter perspective to help you answer the big question: is Chart Industries truly good value?
Approach 1: Chart Industries Discounted Cash Flow (DCF) Analysis
A Discounted Cash Flow (DCF) model estimates a company's intrinsic value by forecasting the cash it will generate in the future and discounting those amounts back to the present. This provides an estimate of what the business is fundamentally worth today based on its ability to create cash over time.
For Chart Industries, the latest reported Free Cash Flow stands at $350.6 million. According to analyst and internal projections, cash flows are projected to grow steadily, reaching around $749 million by the end of 2029. Only the first few years are based on direct analyst estimates, and subsequent figures are extended using in-house methodologies.
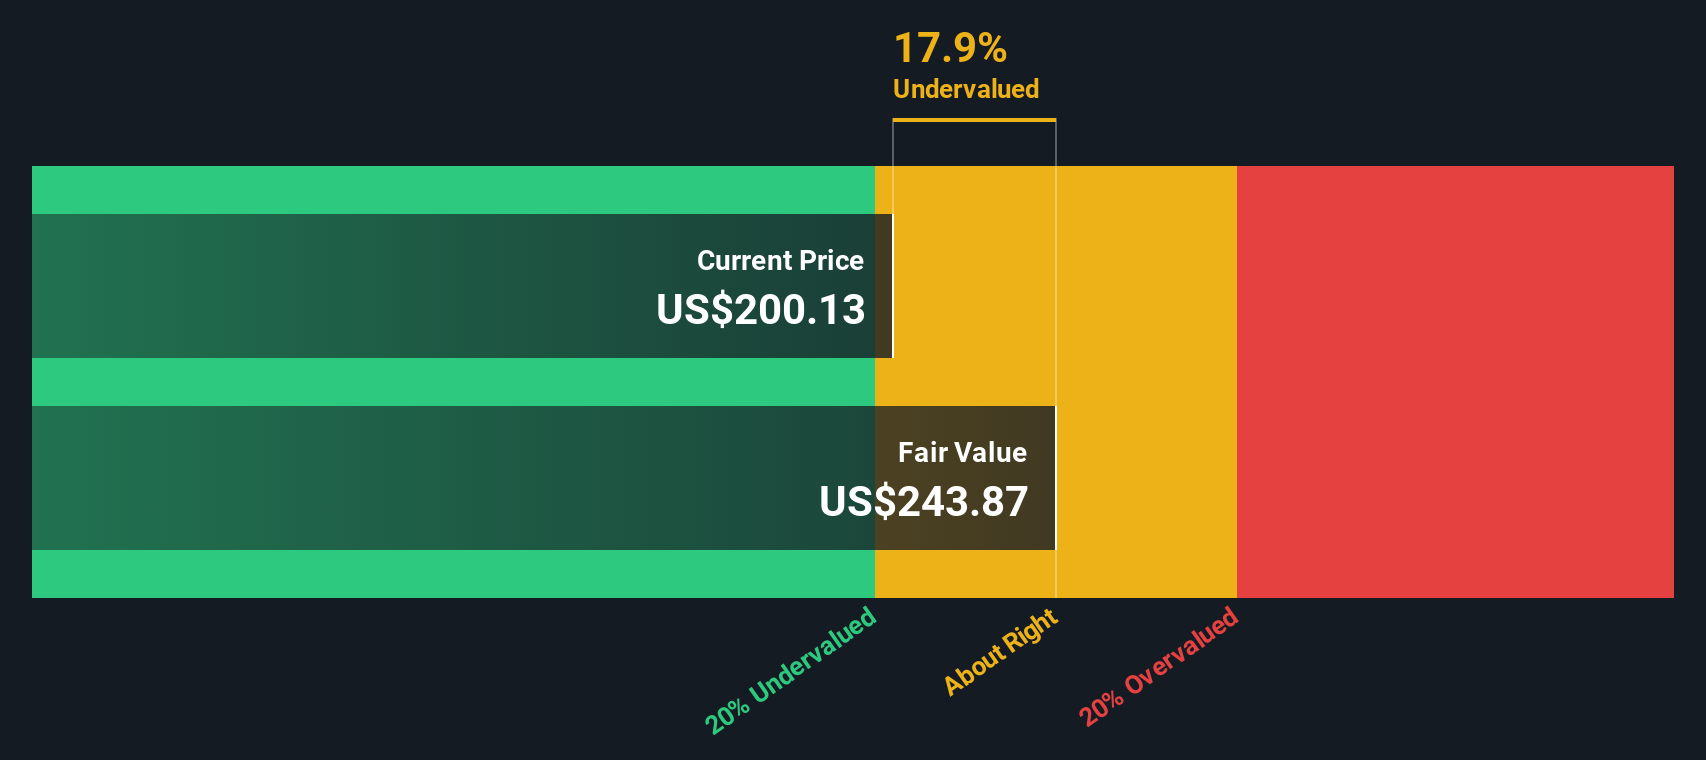
Applying these projections and discounting them back, the intrinsic value per share calculated by the DCF model is $251.10. Compared to its current share price, this implies Chart Industries is trading at a 20.6 percent discount.
In summary, the DCF model suggests that Chart Industries offers a notable margin of safety for investors, as it may be undervalued relative to its cash flow potential.
Result: UNDERVALUED
Our Discounted Cash Flow (DCF) analysis suggests Chart Industries is undervalued by 20.6%. Track this in your watchlist or portfolio, or discover 843 more undervalued stocks based on cash flows.
Approach 2: Chart Industries Price vs Sales
For companies like Chart Industries, which are still scaling profitability and operate in industries with fluctuating earnings, the Price-to-Sales (P/S) ratio is often the most suitable metric for valuation. The P/S ratio focuses on revenue rather than earnings, making it useful when short-term profits might be volatile but sales growth reflects the underlying business trajectory.
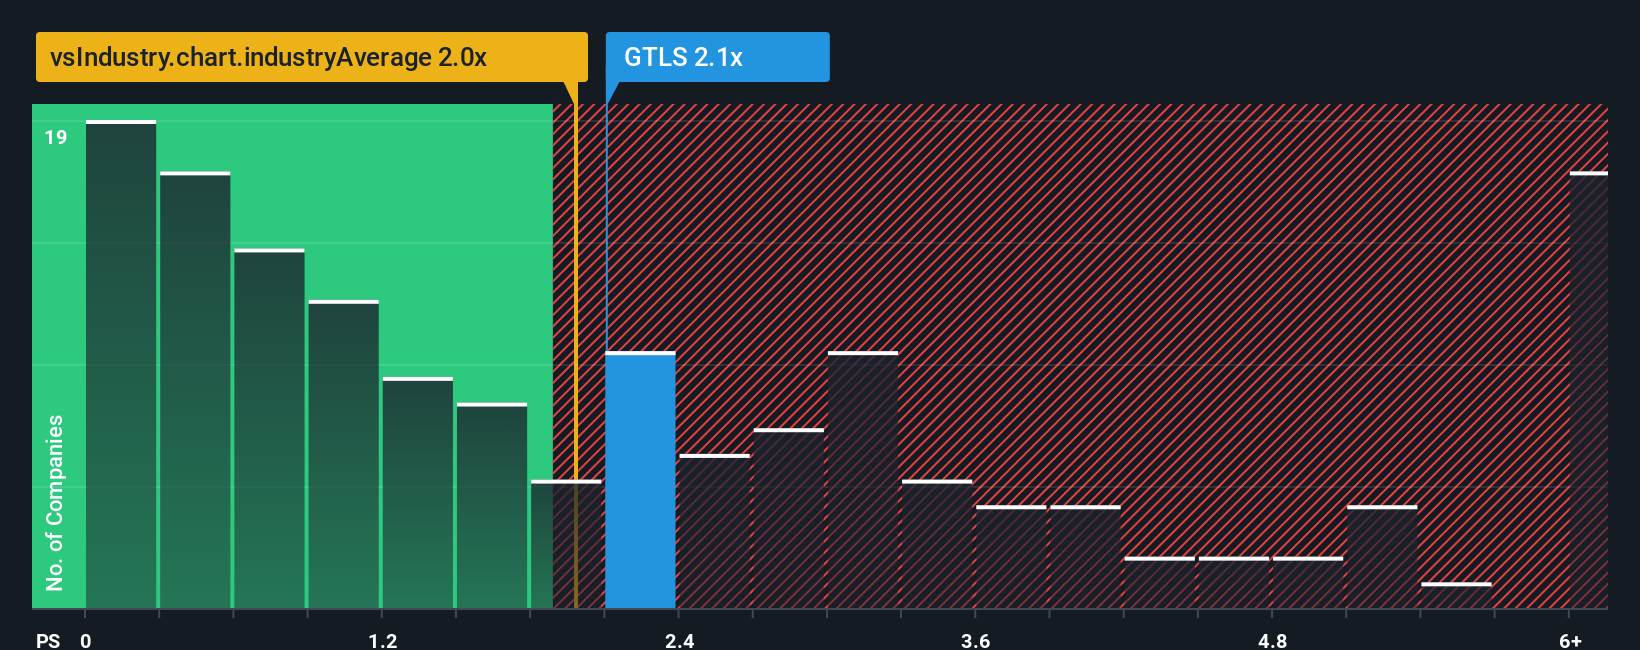
Growth expectations and risk level shape what counts as a “fair” P/S ratio. Fast-growing, innovative companies can command higher P/S ratios, while more mature or riskier businesses generally see lower multiples. For Chart Industries, the current P/S ratio is 2.09x. This figure sits just above the Machinery industry average of 1.95x, but noticeably below the peer group average of 3.38x. This indicates that the stock is valued somewhat conservatively compared to similar companies in its space.
Simply Wall St's proprietary "Fair Ratio" is 2.59x for Chart Industries. Unlike blunt industry comparisons, the Fair Ratio weighs company-specific factors such as projected earnings growth, profit margins, risk profile, and market capitalization to estimate what an appropriate multiple should be. This approach is typically more accurate than simply stacking the company against its peers.
Comparing Chart Industries’ actual P/S of 2.09x to the Fair Ratio of 2.59x suggests the stock is priced below its fundamental potential based on its own prospects and risks, pointing to potential undervaluation.
Result: UNDERVALUED
PS ratios tell one story, but what if the real opportunity lies elsewhere? Discover 1410 companies where insiders are betting big on explosive growth.
Upgrade Your Decision Making: Choose your Chart Industries Narrative
Earlier we mentioned there is an even better way to understand valuation, so let's introduce you to Narratives. A Narrative is a simple but powerful tool that lets you connect the story you believe about a company, like Chart Industries, with your own expectations for its future revenues, earnings, and profit margins. Narratives act as your personalized forecast, tying together your view of the business, the financial outlook, and what you consider a fair value.
Available on the Simply Wall St Community page, Narratives are used by millions of investors to easily develop and share their perspectives. They help you quickly see whether, based on your story and assumptions, a company is undervalued or overvalued compared to its current price. This gives you a clearer signal on buying or selling.
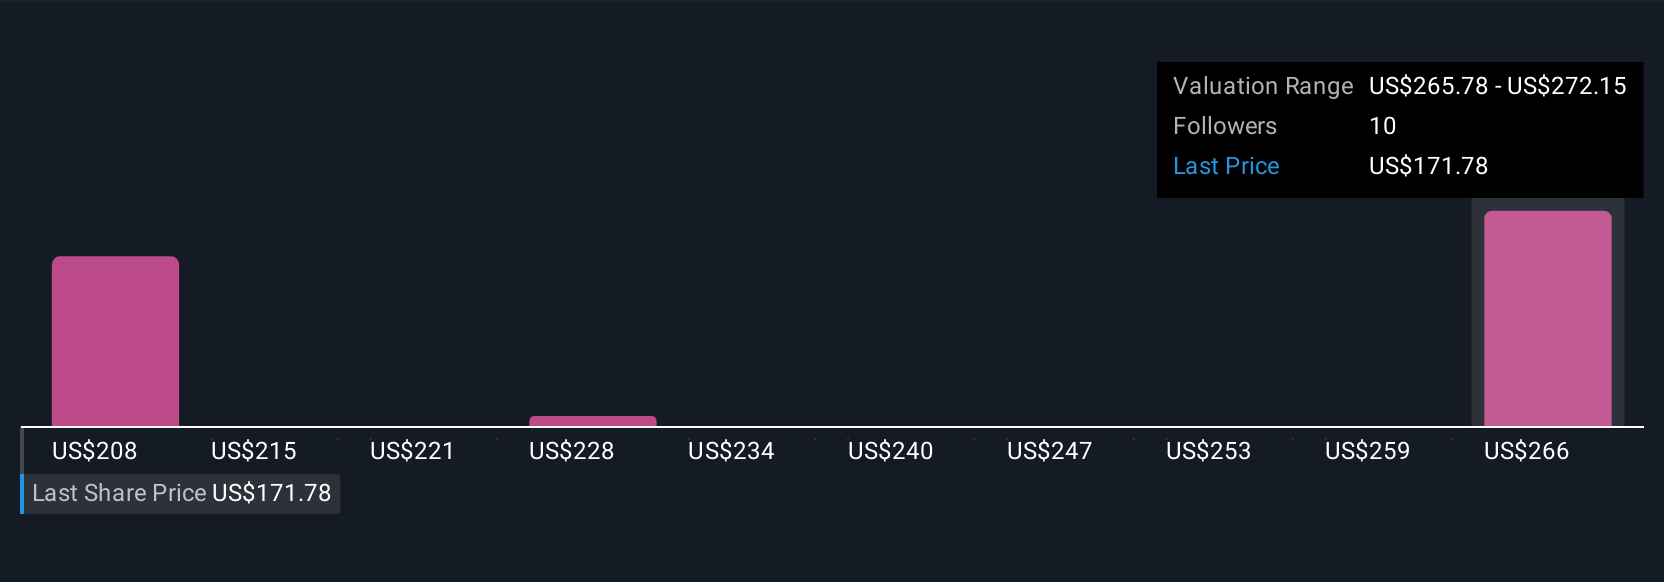
What makes Narratives especially useful is that they update automatically when new information such as news or earnings reports are released, helping you adjust your view dynamically. For instance, one investor might use a bullish Narrative where Chart Industries grows rapidly in LNG and space exploration, targeting a fair value of $227.00. A more cautious investor might highlight margin risks and project delays, landing at a fair value closer to $169.00.
Do you think there's more to the story for Chart Industries? Head over to our Community to see what others are saying!
This article by Simply Wall St is general in nature. We provide commentary based on historical data and analyst forecasts only using an unbiased methodology and our articles are not intended to be financial advice. It does not constitute a recommendation to buy or sell any stock, and does not take account of your objectives, or your financial situation. We aim to bring you long-term focused analysis driven by fundamental data. Note that our analysis may not factor in the latest price-sensitive company announcements or qualitative material. Simply Wall St has no position in any stocks mentioned.
New: AI Stock Screener & Alerts
Our new AI Stock Screener scans the market every day to uncover opportunities.
• Dividend Powerhouses (3%+ Yield)
• Undervalued Small Caps with Insider Buying
• High growth Tech and AI Companies
Or build your own from over 50 metrics.
Have feedback on this article? Concerned about the content? Get in touch with us directly. Alternatively, email editorial-team@simplywallst.com
About NYSE:GTLS
Chart Industries
Engages in the designing, engineering, and manufacturing of process technologies and equipment for the gas and liquid molecules in the United States and internationally.
Good value with moderate growth potential.
Similar Companies
Market Insights

Advertisement
Community Narratives
The company that turned a verb into a global necessity and basically runs the modern internet, digital ads, smartphones, maps, and AI.
Fair Value US$300.00|5.4% undervalued
OS
Community Contributor
Flowers Foods Pays A Fair Price For Health
Fair Value US$16.12|26.3% undervalued
NV
Community Contributor
TMX Group will thrive with 33.3% profit margin and enduring market moat
Fair Value CA$49.90|4.1% overvalued
LI
Community Contributor
The "Molecular Pencil": Why Beam's Technology is Built to Win
Fair Value US$65.01|62.7% undervalued
DA
Community Contributor