Advertisement
- United States
- /
- Machinery
- /
- NYSE:GRC
Gorman-Rupp (GRC): Assessing Valuation After Earnings Miss, Facility Closures, and Operational Realignment

Simply Wall St
Reviewed by Simply Wall St
Gorman-Rupp (GRC) recently reported quarterly results that showed revenues increased compared to last year, although both earnings and revenue missed expectations. In addition to these results, the company announced facility closures and a broader shift in its operational focus.
See our latest analysis for Gorman-Rupp.
Following the earnings miss and facility closures, Gorman-Rupp's stock stumbled, falling 8.7% after results. Still, momentum has been picking up. Its year-to-date share price is up 20.75%, and the total shareholder return over three years stands at 74.53%, pointing to notable long-term value despite some recent volatility.
If you’re keeping an eye out for other under-the-radar opportunities where momentum meets management conviction, now’s the perfect moment to discover fast growing stocks with high insider ownership
With shares pulling back after the latest report but still outperforming over the longer term, the real question is whether Gorman-Rupp remains undervalued at current levels or if the market has already priced in future growth. Is there a buying opportunity here, or is every upside already reflected in the stock?
Price-to-Earnings of 23.6x: Is it justified?
Gorman-Rupp is trading at a price-to-earnings (P/E) ratio of 23.6x, which puts its valuation in focus for investors reviewing its most recent close of $45.04 per share. This figure invites comparison to both the company's fair P/E ratio and industry benchmarks.
The price-to-earnings ratio measures how much investors are willing to pay for each dollar of earnings, making it a crucial indicator for established, profitable manufacturers like Gorman-Rupp. When the P/E ratio is above the market or its fair level, it often signals optimism about future growth or strong competitive positioning, but it can also indicate that the stock is richly valued for its fundamentals.
Gorman-Rupp's P/E of 23.6x is notably higher than its estimated fair price-to-earnings ratio of 18.4x. This indicates that shares are currently expensive relative to what would be expected given its earnings profile. However, compared to the US Machinery industry average of 24.1x, Gorman-Rupp is roughly in line with sector pricing. The company also stands out as attractive when assessed against its peer group, which has an average P/E of 46.3x. This suggests the market views Gorman-Rupp as solid but not in a league with the highest-growth peers. Should sentiment or earnings trajectories shift, the current multiple could move closer to its fair value level.
Explore the SWS fair ratio for Gorman-Rupp
Result: Price-to-Earnings of 23.6x (OVERVALUED)
However, persistent earnings volatility and future facility consolidation could derail the current growth trajectory if there are unfavorable market conditions or execution issues.
Find out about the key risks to this Gorman-Rupp narrative.
Another View: Our DCF Model Weighs In
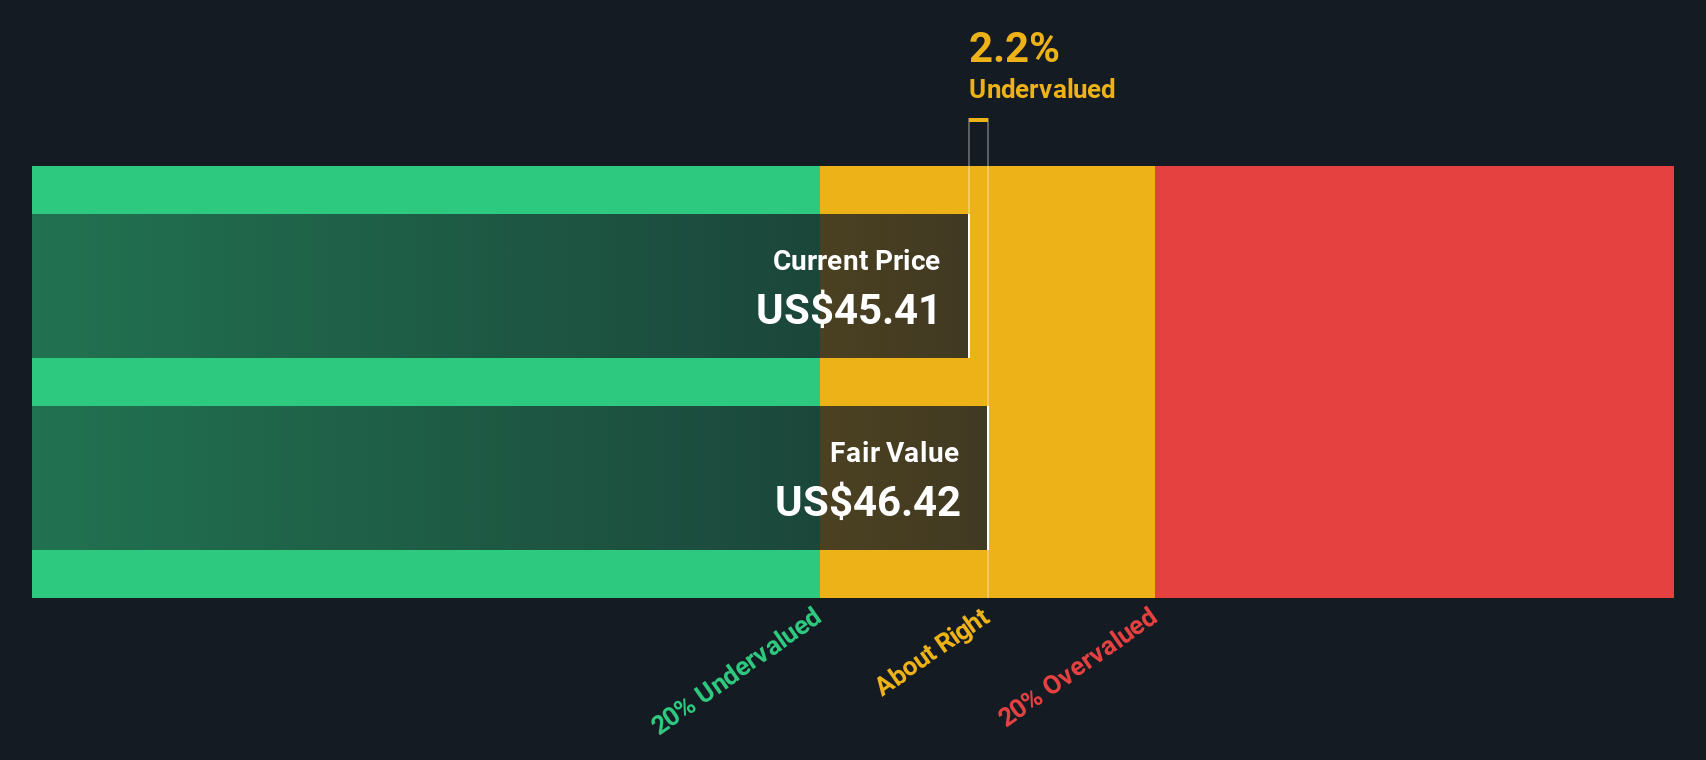
Taking a different approach, the SWS DCF model suggests Gorman-Rupp shares are trading right around fair value, at just 0.5% below our estimate. This perspective challenges the high price-to-earnings concerns. With the two methods so close, does the market have it nailed, or is there hidden upside?
Look into how the SWS DCF model arrives at its fair value.
Simply Wall St performs a discounted cash flow (DCF) on every stock in the world every day (check out Gorman-Rupp for example). We show the entire calculation in full. You can track the result in your watchlist or portfolio and be alerted when this changes, or use our stock screener to discover 877 undervalued stocks based on their cash flows. If you save a screener we even alert you when new companies match - so you never miss a potential opportunity.
Build Your Own Gorman-Rupp Narrative
If you see things differently or want to build your own story from the numbers, you can craft a personal view in just a few minutes. Do it your way
A great starting point for your Gorman-Rupp research is our analysis highlighting 4 key rewards and 1 important warning sign that could impact your investment decision.
Looking for more investment ideas?
Spots on the best stock lists fill up quickly, so now’s your chance to catch tomorrow’s top performers before everyone hears about them.
- Tap into powerful income potential by reviewing these 16 dividend stocks with yields > 3% offering stable yields above 3% for your portfolio.
- Seize early growth opportunities with these 24 AI penny stocks harnessing artificial intelligence to transform entire industries.
- Unlock possibilities in frontier technology by scanning these 26 quantum computing stocks, which is reshaping computing and security for a new era.
This article by Simply Wall St is general in nature. We provide commentary based on historical data and analyst forecasts only using an unbiased methodology and our articles are not intended to be financial advice. It does not constitute a recommendation to buy or sell any stock, and does not take account of your objectives, or your financial situation. We aim to bring you long-term focused analysis driven by fundamental data. Note that our analysis may not factor in the latest price-sensitive company announcements or qualitative material. Simply Wall St has no position in any stocks mentioned.
New: Manage All Your Stock Portfolios in One Place
We've created the ultimate portfolio companion for stock investors, and it's free.
• Connect an unlimited number of Portfolios and see your total in one currency
• Be alerted to new Warning Signs or Risks via email or mobile
• Track the Fair Value of your stocks
Have feedback on this article? Concerned about the content? Get in touch with us directly. Alternatively, email editorial-team@simplywallst.com
About NYSE:GRC
Gorman-Rupp
Designs, manufactures, and sells pumps and pump systems in the United States and internationally.
Solid track record established dividend payer.
Similar Companies
Market Insights

Advertisement
Community Narratives
MINISO's fair value is projected at 26.69 with an anticipated PE ratio shift of 20x
Fair Value US$24.03|11.0% undervalued
BE
Community Contributor
Procter & Gamble: A Dividend Giant Facing Slowing Growth
Fair Value US$119.81|23.3% overvalued
AN
Community Contributor
Eli Lilly's Future Growth Driven by Tirzepatide and Favorable Market Conditions
Fair Value US$1.19k|13.8% undervalued
EA
Community Contributor