
Advertisement
- United States
- /
- Construction
- /
- NYSE:AGX
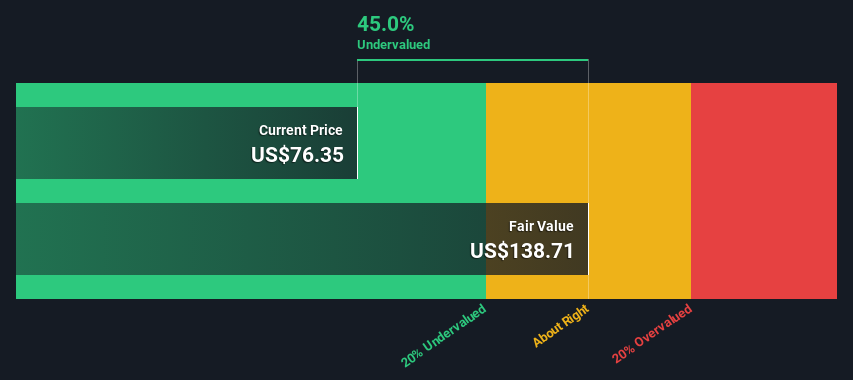
An Intrinsic Calculation For Argan, Inc. (NYSE:AGX) Suggests It's 45% Undervalued
Key Insights
- The projected fair value for Argan is US$139 based on 2 Stage Free Cash Flow to Equity
- Argan's US$76.35 share price signals that it might be 45% undervalued
Today we'll do a simple run through of a valuation method used to estimate the attractiveness of Argan, Inc. (NYSE:AGX) as an investment opportunity by estimating the company's future cash flows and discounting them to their present value. We will use the Discounted Cash Flow (DCF) model on this occasion. Don't get put off by the jargon, the math behind it is actually quite straightforward.
We generally believe that a company's value is the present value of all of the cash it will generate in the future. However, a DCF is just one valuation metric among many, and it is not without flaws. For those who are keen learners of equity analysis, the Simply Wall St analysis model here may be something of interest to you.
See our latest analysis for Argan
What's The Estimated Valuation?
We're using the 2-stage growth model, which simply means we take in account two stages of company's growth. In the initial period the company may have a higher growth rate and the second stage is usually assumed to have a stable growth rate. To start off with, we need to estimate the next ten years of cash flows. Where possible we use analyst estimates, but when these aren't available we extrapolate the previous free cash flow (FCF) from the last estimate or reported value. We assume companies with shrinking free cash flow will slow their rate of shrinkage, and that companies with growing free cash flow will see their growth rate slow, over this period. We do this to reflect that growth tends to slow more in the early years than it does in later years.
A DCF is all about the idea that a dollar in the future is less valuable than a dollar today, so we need to discount the sum of these future cash flows to arrive at a present value estimate:
10-year free cash flow (FCF) estimate
| 2024 | 2025 | 2026 | 2027 | 2028 | 2029 | 2030 | 2031 | 2032 | 2033 | |
| Levered FCF ($, Millions) | US$75.6m | US$67.2m | US$58.3m | US$82.5m | US$89.5m | US$95.4m | US$100.5m | US$105.0m | US$109.0m | US$112.7m |
| Growth Rate Estimate Source | Analyst x2 | Analyst x1 | Analyst x2 | Analyst x1 | Est @ 8.44% | Est @ 6.62% | Est @ 5.35% | Est @ 4.46% | Est @ 3.84% | Est @ 3.40% |
| Present Value ($, Millions) Discounted @ 7.1% | US$70.6 | US$58.6 | US$47.5 | US$62.8 | US$63.6 | US$63.3 | US$62.3 | US$60.8 | US$59.0 | US$57.0 |
("Est" = FCF growth rate estimated by Simply Wall St)
Present Value of 10-year Cash Flow (PVCF) = US$606m
After calculating the present value of future cash flows in the initial 10-year period, we need to calculate the Terminal Value, which accounts for all future cash flows beyond the first stage. The Gordon Growth formula is used to calculate Terminal Value at a future annual growth rate equal to the 5-year average of the 10-year government bond yield of 2.4%. We discount the terminal cash flows to today's value at a cost of equity of 7.1%.
Terminal Value (TV)= FCF2033 × (1 + g) ÷ (r – g) = US$113m× (1 + 2.4%) ÷ (7.1%– 2.4%) = US$2.5b
Present Value of Terminal Value (PVTV)= TV / (1 + r)10= US$2.5b÷ ( 1 + 7.1%)10= US$1.2b
The total value, or equity value, is then the sum of the present value of the future cash flows, which in this case is US$1.9b. In the final step we divide the equity value by the number of shares outstanding. Compared to the current share price of US$76.4, the company appears quite good value at a 45% discount to where the stock price trades currently. The assumptions in any calculation have a big impact on the valuation, so it is better to view this as a rough estimate, not precise down to the last cent.
The Assumptions
Now the most important inputs to a discounted cash flow are the discount rate, and of course, the actual cash flows. You don't have to agree with these inputs, I recommend redoing the calculations yourself and playing with them. The DCF also does not consider the possible cyclicality of an industry, or a company's future capital requirements, so it does not give a full picture of a company's potential performance. Given that we are looking at Argan as potential shareholders, the cost of equity is used as the discount rate, rather than the cost of capital (or weighted average cost of capital, WACC) which accounts for debt. In this calculation we've used 7.1%, which is based on a levered beta of 1.018. Beta is a measure of a stock's volatility, compared to the market as a whole. We get our beta from the industry average beta of globally comparable companies, with an imposed limit between 0.8 and 2.0, which is a reasonable range for a stable business.
SWOT Analysis for Argan
Strength
- Earnings growth over the past year exceeded the industry.
- Currently debt free.
- Dividends are covered by earnings and cash flows.
Weakness
- Earnings growth over the past year is below its 5-year average.
- Dividend is low compared to the top 25% of dividend payers in the Construction market.
Opportunity
- Annual earnings are forecast to grow faster than the American market.
- Trading below our estimate of fair value by more than 20%.
Threat
- No apparent threats visible for AGX.
Moving On:
Whilst important, the DCF calculation ideally won't be the sole piece of analysis you scrutinize for a company. DCF models are not the be-all and end-all of investment valuation. Preferably you'd apply different cases and assumptions and see how they would impact the company's valuation. For instance, if the terminal value growth rate is adjusted slightly, it can dramatically alter the overall result. What is the reason for the share price sitting below the intrinsic value? For Argan, we've put together three pertinent items you should further examine:
- Risks: Case in point, we've spotted 1 warning sign for Argan you should be aware of.
- Future Earnings: How does AGX's growth rate compare to its peers and the wider market? Dig deeper into the analyst consensus number for the upcoming years by interacting with our free analyst growth expectation chart.
- Other Solid Businesses: Low debt, high returns on equity and good past performance are fundamental to a strong business. Why not explore our interactive list of stocks with solid business fundamentals to see if there are other companies you may not have considered!
PS. The Simply Wall St app conducts a discounted cash flow valuation for every stock on the NYSE every day. If you want to find the calculation for other stocks just search here.
New: Manage All Your Stock Portfolios in One Place
We've created the ultimate portfolio companion for stock investors, and it's free.
• Connect an unlimited number of Portfolios and see your total in one currency
• Be alerted to new Warning Signs or Risks via email or mobile
• Track the Fair Value of your stocks
Have feedback on this article? Concerned about the content? Get in touch with us directly. Alternatively, email editorial-team (at) simplywallst.com.
This article by Simply Wall St is general in nature. We provide commentary based on historical data and analyst forecasts only using an unbiased methodology and our articles are not intended to be financial advice. It does not constitute a recommendation to buy or sell any stock, and does not take account of your objectives, or your financial situation. We aim to bring you long-term focused analysis driven by fundamental data. Note that our analysis may not factor in the latest price-sensitive company announcements or qualitative material. Simply Wall St has no position in any stocks mentioned.
About NYSE:AGX
Argan
Through its subsidiaries, provides engineering, procurement, construction, commissioning, maintenance, project development, and technical consulting services to the power generation market in the United States, Republic of Ireland, and the United Kingdom.
Outstanding track record with flawless balance sheet.
Similar Companies
Market Insights

Advertisement
Community Narratives
MINISO's fair value is projected at 26.69 with an anticipated PE ratio shift of 20x
Fair Value US$24.03|11.0% undervalued
BE
Community Contributor
Procter & Gamble: A Dividend Giant Facing Slowing Growth
Fair Value US$119.81|23.3% overvalued
AN
Community Contributor
Eli Lilly's Future Growth Driven by Tirzepatide and Favorable Market Conditions
Fair Value US$1.19k|13.8% undervalued
EA
Community Contributor