
Advertisement
- United States
- /
- Trade Distributors
- /
- NasdaqGS:XMTR
What You Can Learn From Xometry, Inc.'s (NASDAQ:XMTR) P/SAfter Its 44% Share Price Crash
Unfortunately for some shareholders, the Xometry, Inc. (NASDAQ:XMTR) share price has dived 44% in the last thirty days, prolonging recent pain. Longer-term, the stock has been solid despite a difficult 30 days, gaining 18% in the last year.
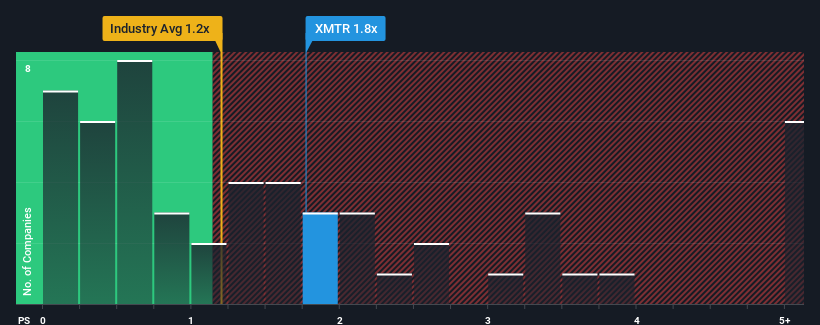
Even after such a large drop in price, you could still be forgiven for thinking Xometry is a stock not worth researching with a price-to-sales ratios (or "P/S") of 1.8x, considering almost half the companies in the United States' Trade Distributors industry have P/S ratios below 1.2x. Although, it's not wise to just take the P/S at face value as there may be an explanation why it's as high as it is.
See our latest analysis for Xometry
How Xometry Has Been Performing
Recent times have been advantageous for Xometry as its revenues have been rising faster than most other companies. It seems that many are expecting the strong revenue performance to persist, which has raised the P/S. However, if this isn't the case, investors might get caught out paying too much for the stock.
Want the full picture on analyst estimates for the company? Then our free report on Xometry will help you uncover what's on the horizon.How Is Xometry's Revenue Growth Trending?
In order to justify its P/S ratio, Xometry would need to produce impressive growth in excess of the industry.
Taking a look back first, we see that the company grew revenue by an impressive 22% last year. The latest three year period has also seen an excellent 228% overall rise in revenue, aided by its short-term performance. Therefore, it's fair to say the revenue growth recently has been superb for the company.
Looking ahead now, revenue is anticipated to climb by 18% per year during the coming three years according to the eight analysts following the company. That's shaping up to be materially higher than the 6.1% each year growth forecast for the broader industry.
With this information, we can see why Xometry is trading at such a high P/S compared to the industry. It seems most investors are expecting this strong future growth and are willing to pay more for the stock.
What Does Xometry's P/S Mean For Investors?
Despite the recent share price weakness, Xometry's P/S remains higher than most other companies in the industry. It's argued the price-to-sales ratio is an inferior measure of value within certain industries, but it can be a powerful business sentiment indicator.
We've established that Xometry maintains its high P/S on the strength of its forecasted revenue growth being higher than the the rest of the Trade Distributors industry, as expected. It appears that shareholders are confident in the company's future revenues, which is propping up the P/S. Unless the analysts have really missed the mark, these strong revenue forecasts should keep the share price buoyant.
You always need to take note of risks, for example - Xometry has 2 warning signs we think you should be aware of.
Of course, profitable companies with a history of great earnings growth are generally safer bets. So you may wish to see this free collection of other companies that have reasonable P/E ratios and have grown earnings strongly.
New: AI Stock Screener & Alerts
Our new AI Stock Screener scans the market every day to uncover opportunities.
• Dividend Powerhouses (3%+ Yield)
• Undervalued Small Caps with Insider Buying
• High growth Tech and AI Companies
Or build your own from over 50 metrics.
Have feedback on this article? Concerned about the content? Get in touch with us directly. Alternatively, email editorial-team (at) simplywallst.com.
This article by Simply Wall St is general in nature. We provide commentary based on historical data and analyst forecasts only using an unbiased methodology and our articles are not intended to be financial advice. It does not constitute a recommendation to buy or sell any stock, and does not take account of your objectives, or your financial situation. We aim to bring you long-term focused analysis driven by fundamental data. Note that our analysis may not factor in the latest price-sensitive company announcements or qualitative material. Simply Wall St has no position in any stocks mentioned.
About NasdaqGS:XMTR
Xometry
Operates an artificial intelligence (AI) powered online manufacturing marketplace in the United States and internationally.
High growth potential with adequate balance sheet.
Similar Companies
Market Insights

Advertisement
Community Narratives
The "Molecular Pencil": Why Beam's Technology is Built to Win
Fair Value US$65.01|65.4% undervalued
DA
Community Contributor
The silent giant behind virtually every advanced chip powering AI, smartphones, and modern infrastructure.
Fair Value US$310.00|6.1% undervalued
OS
Community Contributor
ADP Stock: Solid Fundamentals, But AI Investments Test Its Margin Resilience
Fair Value US$387.77|34.2% undervalued
YI
Community Contributor
MINISO's fair value is projected at 26.69 with an anticipated PE ratio shift of 20x
Fair Value US$24.03|9.6% undervalued
BE
Community Contributor