
Advertisement
- United States
- /
- Machinery
- /
- NasdaqGM:OFLX
Declining Stock and Decent Financials: Is The Market Wrong About Omega Flex, Inc. (NASDAQ:OFLX)?
Omega Flex (NASDAQ:OFLX) has had a rough month with its share price down 8.5%. However, stock prices are usually driven by a company’s financials over the long term, which in this case look pretty respectable. In this article, we decided to focus on Omega Flex's ROE.
Return on equity or ROE is an important factor to be considered by a shareholder because it tells them how effectively their capital is being reinvested. In short, ROE shows the profit each dollar generates with respect to its shareholder investments.
See our latest analysis for Omega Flex
How Do You Calculate Return On Equity?
The formula for ROE is:
Return on Equity = Net Profit (from continuing operations) ÷ Shareholders' Equity
So, based on the above formula, the ROE for Omega Flex is:
44% = US$18m ÷ US$42m (Based on the trailing twelve months to September 2020).
The 'return' refers to a company's earnings over the last year. That means that for every $1 worth of shareholders' equity, the company generated $0.44 in profit.
What Has ROE Got To Do With Earnings Growth?
So far, we've learned that ROE is a measure of a company's profitability. Depending on how much of these profits the company reinvests or "retains", and how effectively it does so, we are then able to assess a company’s earnings growth potential. Assuming everything else remains unchanged, the higher the ROE and profit retention, the higher the growth rate of a company compared to companies that don't necessarily bear these characteristics.
Omega Flex's Earnings Growth And 44% ROE
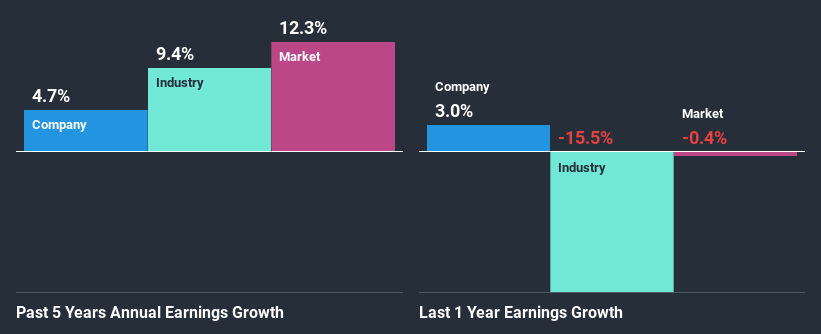
Firstly, we acknowledge that Omega Flex has a significantly high ROE. Additionally, the company's ROE is higher compared to the industry average of 11% which is quite remarkable. However, for some reason, the higher returns aren't reflected in Omega Flex's meagre five year net income growth average of 4.7%. This is interesting as the high returns should mean that the company has the ability to generate high growth but for some reason, it hasn't been able to do so. A few likely reasons why this could happen is that the company could have a high payout ratio or the business has allocated capital poorly, for instance.
We then compared Omega Flex's net income growth with the industry and found that the company's growth figure is lower than the average industry growth rate of 9.4% in the same period, which is a bit concerning.
Earnings growth is an important metric to consider when valuing a stock. The investor should try to establish if the expected growth or decline in earnings, whichever the case may be, is priced in. By doing so, they will have an idea if the stock is headed into clear blue waters or if swampy waters await. One good indicator of expected earnings growth is the P/E ratio which determines the price the market is willing to pay for a stock based on its earnings prospects. So, you may want to check if Omega Flex is trading on a high P/E or a low P/E, relative to its industry.
Is Omega Flex Using Its Retained Earnings Effectively?
With a high three-year median payout ratio of 52% (or a retention ratio of 48%), most of Omega Flex's profits are being paid to shareholders. This definitely contributes to the low earnings growth seen by the company.
In addition, Omega Flex has been paying dividends over a period of seven years suggesting that keeping up dividend payments is way more important to the management even if it comes at the cost of business growth.
Summary
On the whole, we do feel that Omega Flex has some positive attributes. Yet, the low earnings growth is a bit concerning, especially given that the company has a high rate of return. Investors could have benefitted from the high ROE, had the company been reinvesting more of its earnings. As discussed earlier, the company is retaining a small portion of its profits. While we won't completely dismiss the company, what we would do, is try to ascertain how risky the business is to make a more informed decision around the company. Our risks dashboard will have the 1 risk we have identified for Omega Flex.
If you decide to trade Omega Flex, use the lowest-cost* platform that is rated #1 Overall by Barron’s, Interactive Brokers. Trade stocks, options, futures, forex, bonds and funds on 135 markets, all from a single integrated account. Promoted
New: AI Stock Screener & Alerts
Our new AI Stock Screener scans the market every day to uncover opportunities.
• Dividend Powerhouses (3%+ Yield)
• Undervalued Small Caps with Insider Buying
• High growth Tech and AI Companies
Or build your own from over 50 metrics.
This article by Simply Wall St is general in nature. It does not constitute a recommendation to buy or sell any stock, and does not take account of your objectives, or your financial situation. We aim to bring you long-term focused analysis driven by fundamental data. Note that our analysis may not factor in the latest price-sensitive company announcements or qualitative material. Simply Wall St has no position in any stocks mentioned.
*Interactive Brokers Rated Lowest Cost Broker by StockBrokers.com Annual Online Review 2020
Have feedback on this article? Concerned about the content? Get in touch with us directly. Alternatively, email editorial-team (at) simplywallst.com.
About NasdaqGM:OFLX
Omega Flex
Manufactures and sells flexible metal hoses, fittings, and accessories in the United States, Canada, and internationally.
Flawless balance sheet 6 star dividend payer.
Similar Companies
Market Insights

Advertisement
Community Narratives
The company that turned a verb into a global necessity and basically runs the modern internet, digital ads, smartphones, maps, and AI.
Fair Value US$300.00|7.5% undervalued
OS
Community Contributor
Flowers Foods Pays A Fair Price For Health
Fair Value US$16.12|25.4% undervalued
NV
Community Contributor
TMX Group will thrive with 33.3% profit margin and enduring market moat
Fair Value CA$49.90|3.6% overvalued
LI
Community Contributor
The "Molecular Pencil": Why Beam's Technology is Built to Win
Fair Value US$65.01|65.0% undervalued
DA
Community Contributor