Stock Analysis
- United States
- /
- Retail Distributors
- /
- NasdaqGS:WEYS
3 High-Yielding Dividend Stocks From The US With Yields Up To 7.8%

Reviewed by Simply Wall St

Amid a backdrop of optimism in the U.S. stock market, with major indices approaching record highs and investor sentiment boosted by favorable inflation data, attention turns to the resilience and appeal of high-yielding dividend stocks. In times like these, when economic indicators show potential shifts in monetary policy, dividend stocks can offer both income and stability for investors seeking to balance their portfolios.
Top 10 Dividend Stocks In The United States
| Name | Dividend Yield | Dividend Rating |
| Columbia Banking System (NasdaqGS:COLB) | 7.17% | ★★★★★★ |
| Resources Connection (NasdaqGS:RGP) | 4.95% | ★★★★★★ |
| Silvercrest Asset Management Group (NasdaqGM:SAMG) | 4.87% | ★★★★★★ |
| Regions Financial (NYSE:RF) | 4.83% | ★★★★★★ |
| Dillard's (NYSE:DDS) | 4.82% | ★★★★★★ |
| Citizens Financial Group (NYSE:CFG) | 4.60% | ★★★★★★ |
| CompX International (NYSEAM:CIX) | 5.05% | ★★★★★★ |
| Ennis (NYSE:EBF) | 4.88% | ★★★★★★ |
| Credicorp (NYSE:BAP) | 5.70% | ★★★★★☆ |
| West Bancorporation (NasdaqGS:WTBA) | 5.71% | ★★★★★☆ |
Click here to see the full list of 201 stocks from our Top Dividend Stocks screener.
Here we highlight a subset of our preferred stocks from the screener.
Spok Holdings (NasdaqGS:SPOK)
Simply Wall St Dividend Rating: ★★★★☆☆
Overview: Spok Holdings, Inc. offers healthcare communication solutions across the United States, Europe, Canada, Australia, Asia, and the Middle East with a market capitalization of approximately $319.27 million.
Operations: Spok Holdings, Inc. generates its revenue primarily from its Clinical Communication and Collaboration Business, which amounted to $140.75 million.
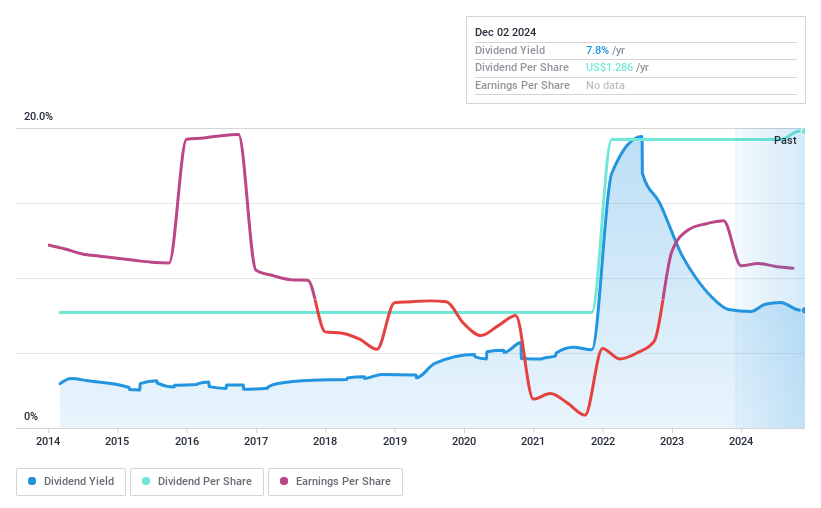
Dividend Yield: 7.8%
Spok Holdings offers a high dividend yield of 7.82%, ranking in the top 25% of US dividend payers. However, this dividend is not well-supported by earnings or cash flows, with payout ratios at 149.1% and cash payout ratios at 115.4%. Despite these challenges, Spok has maintained stable dividends over the past decade and even increased them, demonstrating reliability in payments. Recent financial results show an uptick in revenue and net income, suggesting some operational improvement, though profit margins have decreased from last year's levels.
- Take a closer look at Spok Holdings' potential here in our dividend report.
- The analysis detailed in our Spok Holdings valuation report hints at an deflated share price compared to its estimated value.
Weyco Group (NasdaqGS:WEYS)
Simply Wall St Dividend Rating: ★★★★★☆
Overview: Weyco Group, Inc. is a company that designs and distributes footwear for men, women, and children, with a market capitalization of approximately $284.85 million.
Operations: Weyco Group, Inc. generates revenue primarily through its wholesale segment, which brought in $236.75 million, and its retail operations, which accounted for $38.90 million.
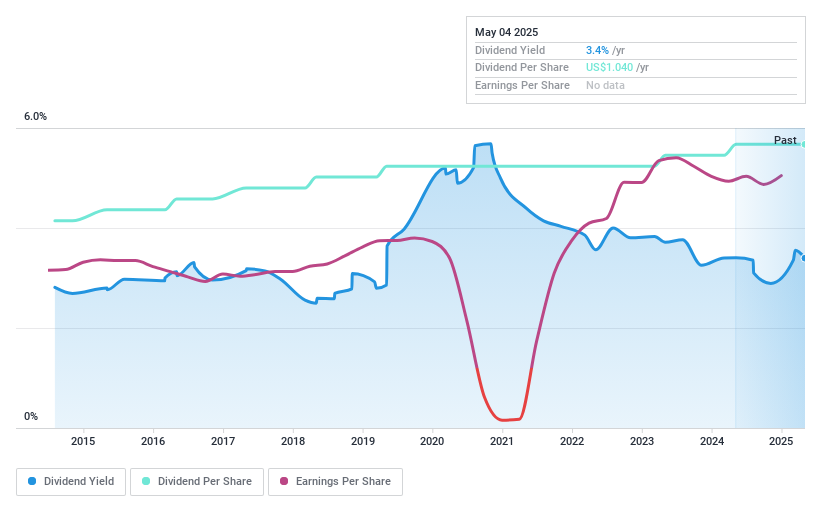
Dividend Yield: 3.4%
Weyco Group maintains a stable dividend history over the last decade, with a recent declaration of US$0.26 per share. Despite lower sales and net income in Q1 2024 compared to the previous year, dividends are well-covered by both earnings and cash flows, with payout ratios of 32.4% and cash payout ratios of 11.3%. However, its dividend yield at 3.44% is below the top quartile of US dividend payers, and ongoing insider selling could raise concerns about future performance stability.
- Delve into the full analysis dividend report here for a deeper understanding of Weyco Group.
- Our valuation report unveils the possibility Weyco Group's shares may be trading at a premium.
Evans Bancorp (NYSEAM:EVBN)
Simply Wall St Dividend Rating: ★★★★★☆
Overview: Evans Bancorp, Inc. serves primarily as a financial holding company for Evans Bank, N.A., with a market capitalization of approximately $154.46 million.
Operations: Evans Bancorp, Inc. generates its revenue primarily through banking activities, totaling approximately $60.36 million.
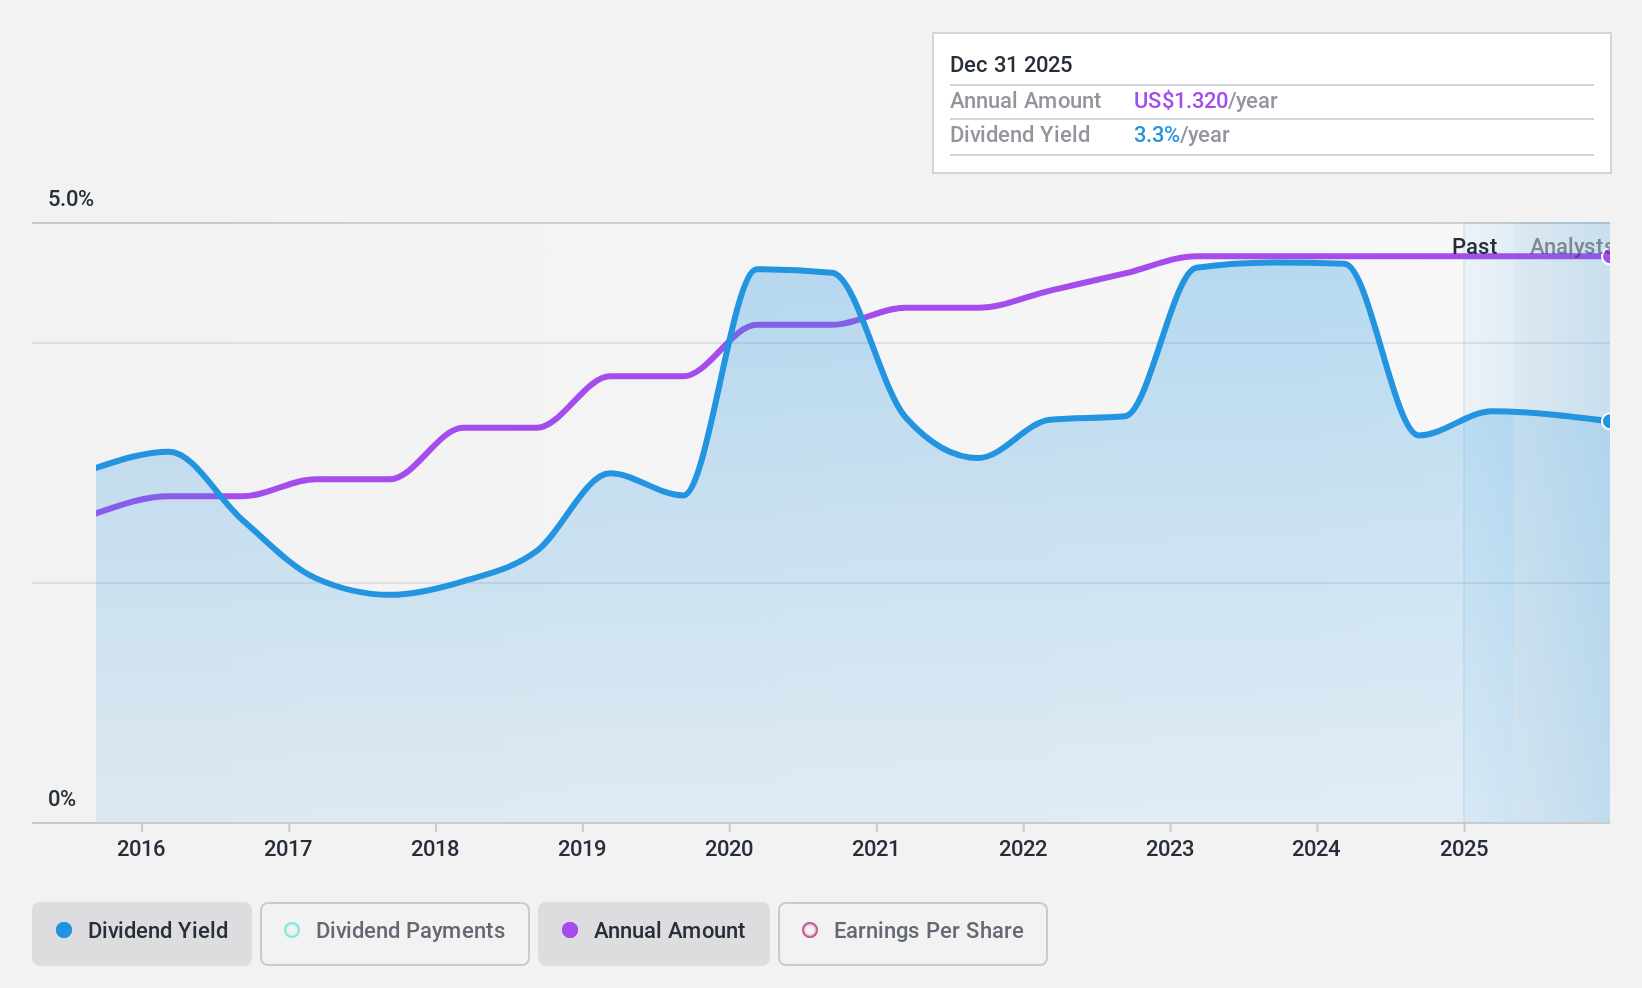
Dividend Yield: 4.7%
Evans Bancorp has demonstrated a consistent dividend history, with a notable yield of 4.66%, placing it in the top 25% of US dividend payers. The dividends are well-supported by earnings, evidenced by a payout ratio of 34.3%. However, recent financials show challenges: Q1 2024 saw a decline in net interest income to US$13.91 million from US$17.33 million year-over-year and a drop in net income to US$2.33 million from US$5.8 million. Additionally, there's been significant insider selling recently, which might concern investors about long-term stability.
- Click to explore a detailed breakdown of our findings in Evans Bancorp's dividend report.
- In light of our recent valuation report, it seems possible that Evans Bancorp is trading behind its estimated value.
Next Steps
- Navigate through the entire inventory of 201 Top Dividend Stocks here.
- Already own these companies? Link your portfolio to Simply Wall St and get alerts on any new warning signs to your stocks.
- Join a community of smart investors by using Simply Wall St. It's free and delivers expert-level analysis on worldwide markets.
Ready For A Different Approach?
- Explore high-performing small cap companies that haven't yet garnered significant analyst attention.
- Fuel your portfolio with companies showing strong growth potential, backed by optimistic outlooks both from analysts and management.
- Find companies with promising cash flow potential yet trading below their fair value.
This article by Simply Wall St is general in nature. We provide commentary based on historical data and analyst forecasts only using an unbiased methodology and our articles are not intended to be financial advice. It does not constitute a recommendation to buy or sell any stock, and does not take account of your objectives, or your financial situation. We aim to bring you long-term focused analysis driven by fundamental data. Note that our analysis may not factor in the latest price-sensitive company announcements or qualitative material. Simply Wall St has no position in any stocks mentioned.
Valuation is complex, but we're helping make it simple.
Find out whether Weyco Group is potentially over or undervalued by checking out our comprehensive analysis, which includes fair value estimates, risks and warnings, dividends, insider transactions and financial health.
View the Free AnalysisHave feedback on this article? Concerned about the content? Get in touch with us directly. Alternatively, email editorial-team@simplywallst.com
About NasdaqGS:WEYS
Weyco Group
Designs and distributes footwear for men, women, and children.
Flawless balance sheet established dividend payer.

