- United States
- /
- Banks
- /
- NasdaqGS:PPBI
The past three years for Pacific Premier Bancorp (NASDAQ:PPBI) investors has not been profitable


For many investors, the main point of stock picking is to generate higher returns than the overall market. But if you try your hand at stock picking, you risk returning less than the market. Unfortunately, that's been the case for longer term Pacific Premier Bancorp, Inc. (NASDAQ:PPBI) shareholders, since the share price is down 49% in the last three years, falling well short of the market return of around 19%. The falls have accelerated recently, with the share price down 10% in the last three months.
With that in mind, it's worth seeing if the company's underlying fundamentals have been the driver of long term performance, or if there are some discrepancies.
Check out our latest analysis for Pacific Premier Bancorp
In his essay The Superinvestors of Graham-and-Doddsville Warren Buffett described how share prices do not always rationally reflect the value of a business. One flawed but reasonable way to assess how sentiment around a company has changed is to compare the earnings per share (EPS) with the share price.
During the three years that the share price fell, Pacific Premier Bancorp's earnings per share (EPS) dropped by 51% each year. This fall in the EPS is worse than the 20% compound annual share price fall. So the market may not be too worried about the EPS figure, at the moment -- or it may have previously priced some of the drop in. With a P/E ratio of 156.63, it's fair to say the market sees a brighter future for the business.
You can see how EPS has changed over time in the image below (click on the chart to see the exact values).
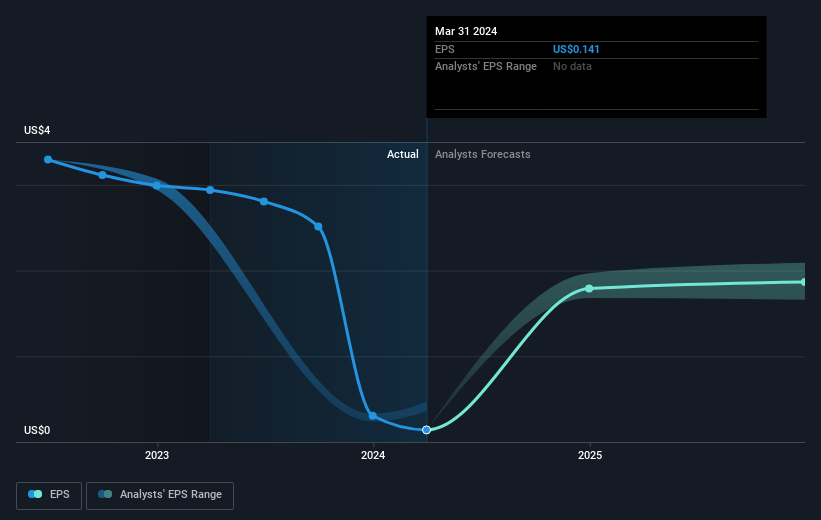
Dive deeper into Pacific Premier Bancorp's key metrics by checking this interactive graph of Pacific Premier Bancorp's earnings, revenue and cash flow.
What About Dividends?
When looking at investment returns, it is important to consider the difference between total shareholder return (TSR) and share price return. Whereas the share price return only reflects the change in the share price, the TSR includes the value of dividends (assuming they were reinvested) and the benefit of any discounted capital raising or spin-off. Arguably, the TSR gives a more comprehensive picture of the return generated by a stock. As it happens, Pacific Premier Bancorp's TSR for the last 3 years was -41%, which exceeds the share price return mentioned earlier. The dividends paid by the company have thusly boosted the total shareholder return.
A Different Perspective
Pacific Premier Bancorp shareholders gained a total return of 10% during the year. But that was short of the market average. On the bright side, that's still a gain, and it is certainly better than the yearly loss of about 2% endured over half a decade. So this might be a sign the business has turned its fortunes around. It's always interesting to track share price performance over the longer term. But to understand Pacific Premier Bancorp better, we need to consider many other factors. Even so, be aware that Pacific Premier Bancorp is showing 2 warning signs in our investment analysis , you should know about...
We will like Pacific Premier Bancorp better if we see some big insider buys. While we wait, check out this free list of undervalued stocks (mostly small caps) with considerable, recent, insider buying.
Please note, the market returns quoted in this article reflect the market weighted average returns of stocks that currently trade on American exchanges.
New: Manage All Your Stock Portfolios in One Place
We've created the ultimate portfolio companion for stock investors, and it's free.
• Connect an unlimited number of Portfolios and see your total in one currency
• Be alerted to new Warning Signs or Risks via email or mobile
• Track the Fair Value of your stocks
Have feedback on this article? Concerned about the content? Get in touch with us directly. Alternatively, email editorial-team (at) simplywallst.com.
This article by Simply Wall St is general in nature. We provide commentary based on historical data and analyst forecasts only using an unbiased methodology and our articles are not intended to be financial advice. It does not constitute a recommendation to buy or sell any stock, and does not take account of your objectives, or your financial situation. We aim to bring you long-term focused analysis driven by fundamental data. Note that our analysis may not factor in the latest price-sensitive company announcements or qualitative material. Simply Wall St has no position in any stocks mentioned.
Have feedback on this article? Concerned about the content? Get in touch with us directly. Alternatively, email editorial-team@simplywallst.com
About NasdaqGS:PPBI
Pacific Premier Bancorp
Operates as the bank holding company for Pacific Premier Bank that provides various banking products and services in the United States.
Flawless balance sheet with reasonable growth potential.

