
Advertisement
Howard Marks put it nicely when he said that, rather than worrying about share price volatility, 'The possibility of permanent loss is the risk I worry about... and every practical investor I know worries about.' It's only natural to consider a company's balance sheet when you examine how risky it is, since debt is often involved when a business collapses. We note that THOR Industries, Inc. (NYSE:THO) does have debt on its balance sheet. But is this debt a concern to shareholders?
When Is Debt Dangerous?
Debt assists a business until the business has trouble paying it off, either with new capital or with free cash flow. In the worst case scenario, a company can go bankrupt if it cannot pay its creditors. However, a more usual (but still expensive) situation is where a company must dilute shareholders at a cheap share price simply to get debt under control. Having said that, the most common situation is where a company manages its debt reasonably well - and to its own advantage. When we examine debt levels, we first consider both cash and debt levels, together.
Check out our latest analysis for THOR Industries
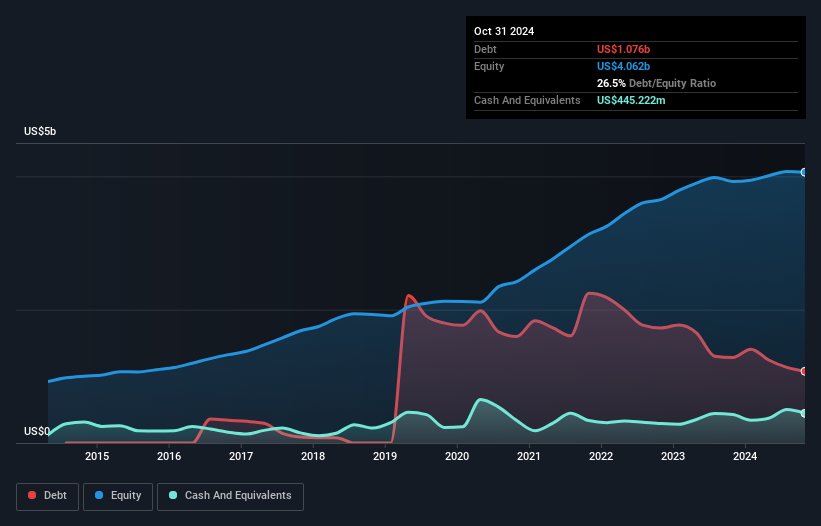
How Much Debt Does THOR Industries Carry?
The image below, which you can click on for greater detail, shows that THOR Industries had debt of US$1.08b at the end of October 2024, a reduction from US$1.28b over a year. On the flip side, it has US$445.2m in cash leading to net debt of about US$630.8m.
How Strong Is THOR Industries' Balance Sheet?
We can see from the most recent balance sheet that THOR Industries had liabilities of US$1.48b falling due within a year, and liabilities of US$1.33b due beyond that. Offsetting this, it had US$445.2m in cash and US$638.4m in receivables that were due within 12 months. So its liabilities outweigh the sum of its cash and (near-term) receivables by US$1.73b.
THOR Industries has a market capitalization of US$5.44b, so it could very likely raise cash to ameliorate its balance sheet, if the need arose. But we definitely want to keep our eyes open to indications that its debt is bringing too much risk.
We measure a company's debt load relative to its earnings power by looking at its net debt divided by its earnings before interest, tax, depreciation, and amortization (EBITDA) and by calculating how easily its earnings before interest and tax (EBIT) cover its interest expense (interest cover). Thus we consider debt relative to earnings both with and without depreciation and amortization expenses.
While THOR Industries's low debt to EBITDA ratio of 1.0 suggests only modest use of debt, the fact that EBIT only covered the interest expense by 3.9 times last year does give us pause. But the interest payments are certainly sufficient to have us thinking about how affordable its debt is. Importantly, THOR Industries's EBIT fell a jaw-dropping 32% in the last twelve months. If that decline continues then paying off debt will be harder than selling foie gras at a vegan convention. When analysing debt levels, the balance sheet is the obvious place to start. But it is future earnings, more than anything, that will determine THOR Industries's ability to maintain a healthy balance sheet going forward. So if you're focused on the future you can check out this free report showing analyst profit forecasts.
But our final consideration is also important, because a company cannot pay debt with paper profits; it needs cold hard cash. So we clearly need to look at whether that EBIT is leading to corresponding free cash flow. During the last three years, THOR Industries generated free cash flow amounting to a very robust 87% of its EBIT, more than we'd expect. That puts it in a very strong position to pay down debt.
Our View
Based on what we've seen THOR Industries is not finding it easy, given its EBIT growth rate, but the other factors we considered give us cause to be optimistic. There's no doubt that its ability to to convert EBIT to free cash flow is pretty flash. When we consider all the factors mentioned above, we do feel a bit cautious about THOR Industries's use of debt. While debt does have its upside in higher potential returns, we think shareholders should definitely consider how debt levels might make the stock more risky. When analysing debt levels, the balance sheet is the obvious place to start. However, not all investment risk resides within the balance sheet - far from it. These risks can be hard to spot. Every company has them, and we've spotted 1 warning sign for THOR Industries you should know about.
When all is said and done, sometimes its easier to focus on companies that don't even need debt. Readers can access a list of growth stocks with zero net debt 100% free, right now.
Valuation is complex, but we're here to simplify it.
Discover if THOR Industries might be undervalued or overvalued with our detailed analysis, featuring fair value estimates, potential risks, dividends, insider trades, and its financial condition.
Access Free AnalysisHave feedback on this article? Concerned about the content? Get in touch with us directly. Alternatively, email editorial-team (at) simplywallst.com.
This article by Simply Wall St is general in nature. We provide commentary based on historical data and analyst forecasts only using an unbiased methodology and our articles are not intended to be financial advice. It does not constitute a recommendation to buy or sell any stock, and does not take account of your objectives, or your financial situation. We aim to bring you long-term focused analysis driven by fundamental data. Note that our analysis may not factor in the latest price-sensitive company announcements or qualitative material. Simply Wall St has no position in any stocks mentioned.
About NYSE:THO
THOR Industries
Designs, manufactures, and sells recreational vehicles (RVs), and related parts and accessories in the United States, Germany, rest of Europe, Canada, and internationally.
Flawless balance sheet established dividend payer.
Similar Companies
Market Insights

Advertisement
Community Narratives
MicroVision will explode future revenue by 380.37% with a vision towards success
Fair Value US$60.00|98.5% undervalued
TH
Community Contributor
The Indispensable Artery for a New North American Economy
Fair Value CA$132.87|2.3% undervalued
TI
Community Contributor