Advertisement
- United States
- /
- Auto
- /
- NYSE:RACE
Is Ferrari Still Worth Its Price After the Recent 6.7% Slide in 2025?

Simply Wall St
Reviewed by Bailey Pemberton
- Thinking about whether Ferrari stock is trading at a fair price? You are not alone, and there is more to the story than what the market ticker shows.
- After riding an exceptional multiyear run, Ferrari shares have hit a bump recently, sliding 6.7% in the last week and remaining down 6.5% year-to-date.
- Headlines in recent weeks have focused on industry shifts, luxury brand demand, and ongoing shareholder debates regarding innovation versus tradition at Ferrari. These stories are influencing market sentiment just as much as raw numbers or quarterly profits.
- Looking at the valuation score, Ferrari currently does not meet the criteria for undervaluation on any of the six metrics [0/6], raising real questions about what the market is recognizing. Next, we will break down the main valuation approaches and, at the end, introduce a method that might offer greater insight.
Ferrari scores just 0/6 on our valuation checks. See what other red flags we found in the full valuation breakdown.
Approach 1: Ferrari Discounted Cash Flow (DCF) Analysis
The Discounted Cash Flow (DCF) model estimates a company's intrinsic value by projecting its future cash flows and discounting them back to today's value. This approach aims to capture both current company performance and future growth potential using analyst forecasts and established extrapolation techniques.
For Ferrari, the most recent reported Free Cash Flow is €1.28 Billion. Analyst estimates see Free Cash Flow growing over the next several years, reaching €1.93 Billion by 2029. While analyst projections cover about five years, later forecasts are generated by extrapolating Ferrari’s likely performance trends. According to these models, annual Free Cash Flow could exceed €2.5 Billion by 2035.
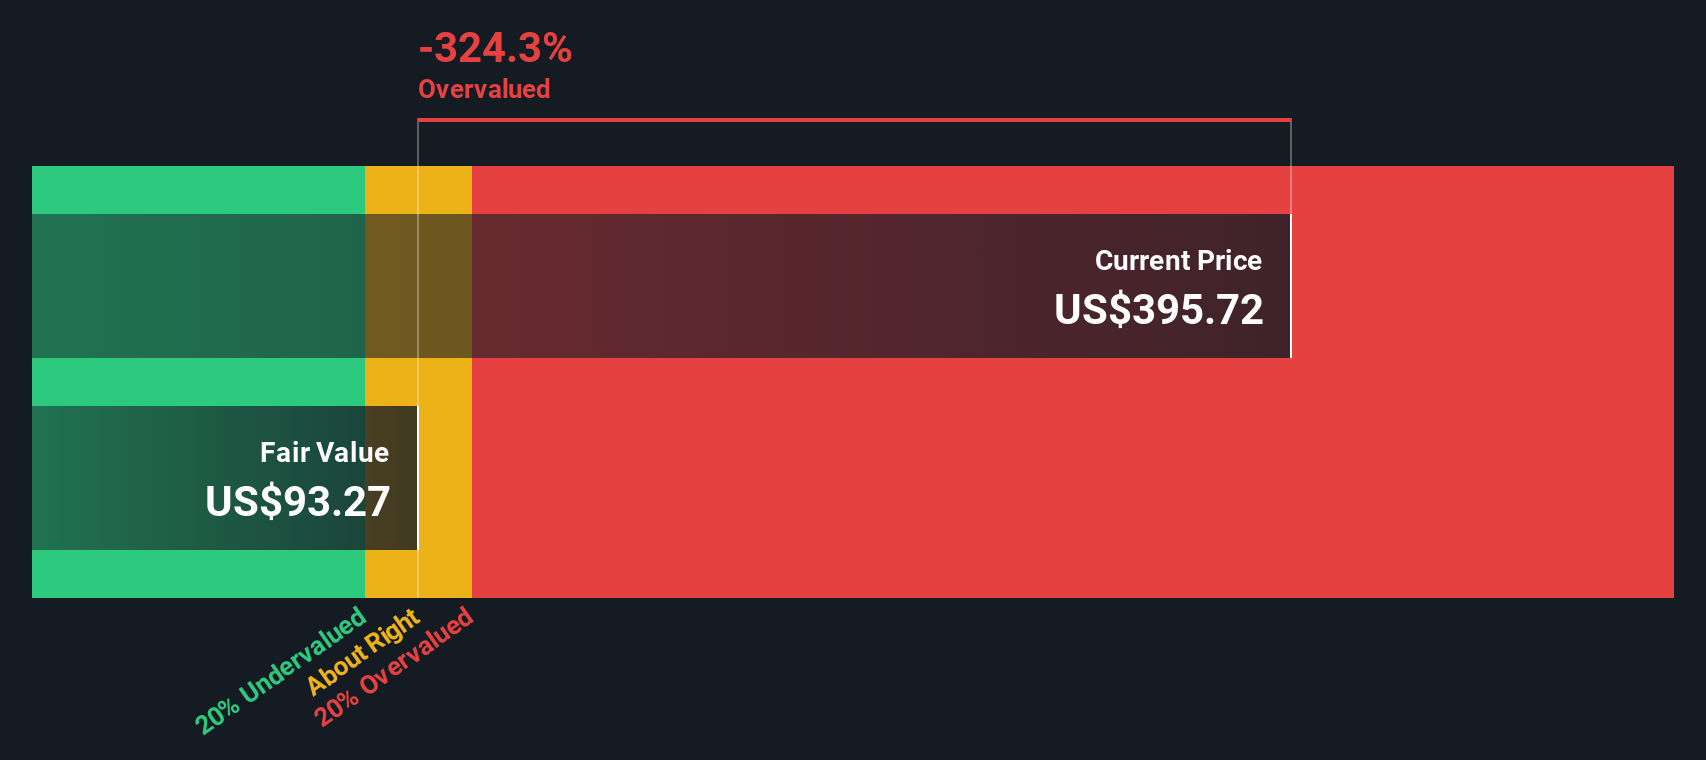
Despite these optimistic growth figures, the DCF model currently estimates Ferrari’s intrinsic value at €103.91 per share. This is 274.6% below the current stock price. This result indicates that the shares are trading significantly above the value implied by long-term cash flows.
In summary, even when accounting for ongoing growth, the DCF suggests that Ferrari stock is considerably overvalued compared to its future cash-generating potential.
Result: OVERVALUED
Our Discounted Cash Flow (DCF) analysis suggests Ferrari may be overvalued by 274.6%. Discover 928 undervalued stocks or create your own screener to find better value opportunities.
Approach 2: Ferrari Price vs Earnings (P/E)
The Price-to-Earnings (P/E) ratio is a widely used valuation metric for profitable companies like Ferrari because it helps investors gauge how much they are paying for each euro of the company's earnings. It is especially relevant for businesses with steady or growing profits, as it directly links the share price to fundamental company performance.
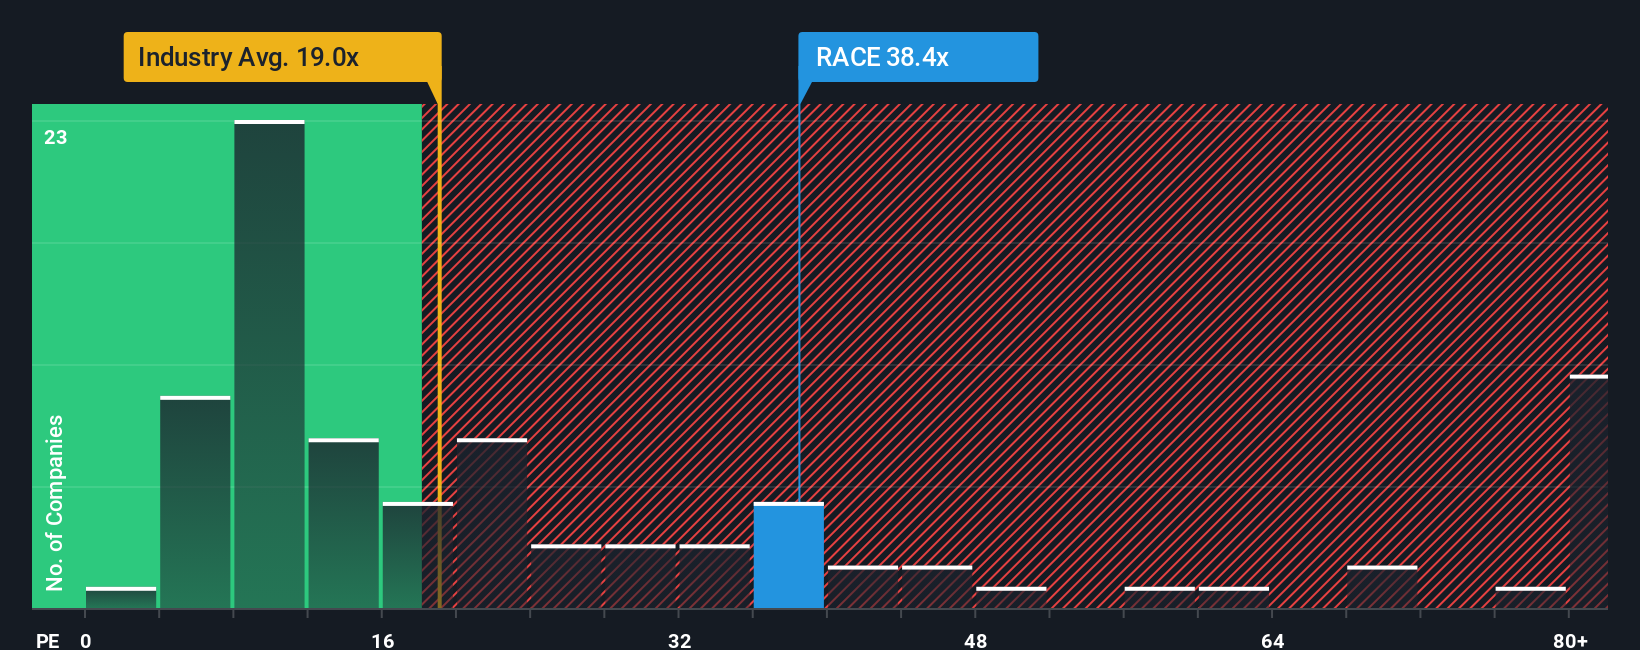
Growth expectations and perceived risk play important roles in what constitutes a "normal" or "fair" P/E ratio. Companies expected to achieve faster earnings growth or those seen as lower risk typically command higher multiples, and vice versa. As investors look to the auto industry, the average P/E ratio is 17.68x, while Ferrari's direct peers trade much lower at 15.29x. In contrast, Ferrari currently trades at a P/E multiple of 37.38x, which is more than double the industry average.
This is where the "Fair Ratio" comes into play. Simply Wall St’s Fair Ratio, calculated based on factors like growth prospects, profit margins, industry context, and market capitalization, is 14.40x for Ferrari. This proprietary benchmark is more useful than simple peer or sector averages because it reflects the unique mix of growth, size, and risk for each company, rather than taking a one-size-fits-all approach.
Comparing Ferrari’s actual P/E of 37.38x to its Fair Ratio of 14.40x shows the stock is trading well above what would be considered justified by its fundamentals and risk profile.
Result: OVERVALUED
PE ratios tell one story, but what if the real opportunity lies elsewhere? Discover 1432 companies where insiders are betting big on explosive growth.
Upgrade Your Decision Making: Choose your Ferrari Narrative
Earlier we mentioned that there is an even better way to understand valuation, so let's introduce you to Narratives. A Narrative is simply your story about Ferrari, based on the facts and your perspective on its future. You set your own assumptions for fair value, revenue growth, and profit margins, then see how this story lines up with the numbers.
Narratives go beyond just comparing ratios, linking the company's unique story, future prospects, and recent events directly to a financial forecast and a fair value estimate. This approach is not only more personal and dynamic, it also makes the investment process clearer and helps you see why you or other investors might decide if Ferrari is a buy, sell, or hold at the current price.
Available directly on Simply Wall St's Community page, Narratives are used by millions of investors and are automatically updated when there is fresh news, earnings, or company developments, so your viewpoint always keeps pace with reality.
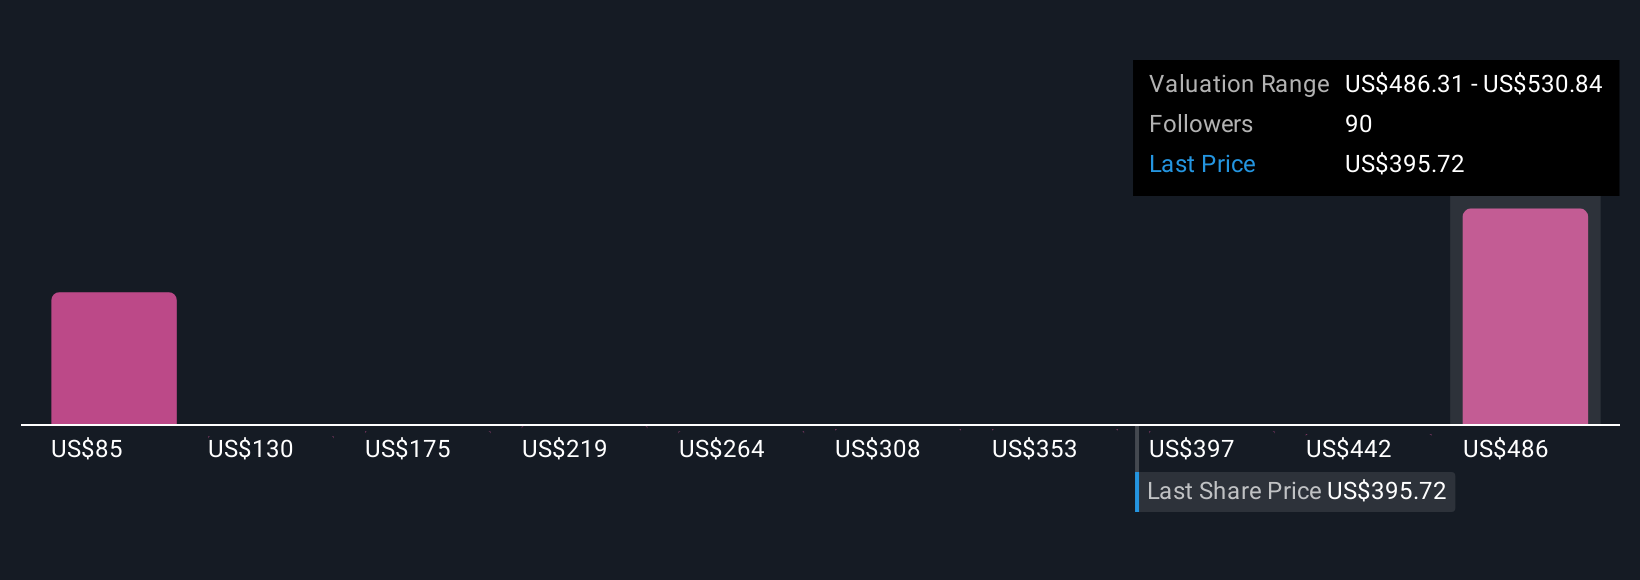
For example, some investors believe Ferrari's infrastructure expansion and electrification will drive long-term growth, assigning a fair value as high as $597 per share. Others are more cautious about potential brand dilution, placing fair value closer to $397. Narratives let you compare these perspectives and make smarter investment decisions based on what you believe is most likely.
Do you think there's more to the story for Ferrari? Head over to our Community to see what others are saying!
This article by Simply Wall St is general in nature. We provide commentary based on historical data and analyst forecasts only using an unbiased methodology and our articles are not intended to be financial advice. It does not constitute a recommendation to buy or sell any stock, and does not take account of your objectives, or your financial situation. We aim to bring you long-term focused analysis driven by fundamental data. Note that our analysis may not factor in the latest price-sensitive company announcements or qualitative material. Simply Wall St has no position in any stocks mentioned.
New: AI Stock Screener & Alerts
Our new AI Stock Screener scans the market every day to uncover opportunities.
• Dividend Powerhouses (3%+ Yield)
• Undervalued Small Caps with Insider Buying
• High growth Tech and AI Companies
Or build your own from over 50 metrics.
Have feedback on this article? Concerned about the content? Get in touch with us directly. Alternatively, email editorial-team@simplywallst.com
About NYSE:RACE
Ferrari
Through its subsidiaries, engages in design, engineering, production, and sale of luxury performance sports cars worldwide.
Flawless balance sheet with solid track record.
Market Insights

Advertisement
Community Narratives
MicroVision will explode future revenue by 380.37% with a vision towards success
Fair Value US$60.00|98.4% undervalued
TH
Community Contributor
The Indispensable Artery for a New North American Economy
Fair Value CA$132.87|1.3% undervalued
TI
Community Contributor