- United States
- /
- Auto
- /
- NasdaqGM:NIU
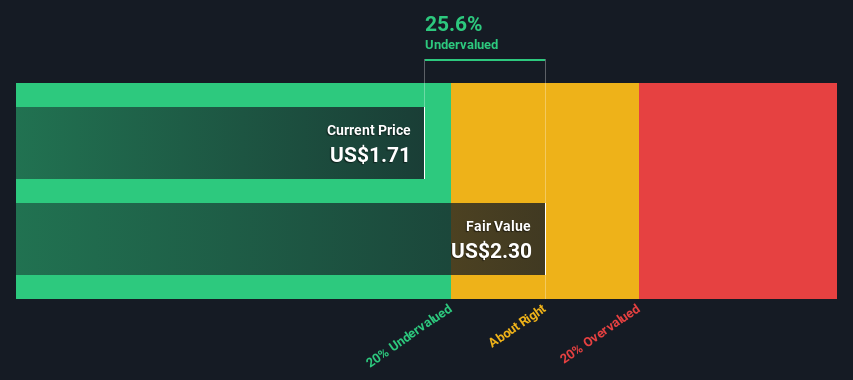
Is There An Opportunity With Niu Technologies' (NASDAQ:NIU) 26% Undervaluation?

Key Insights
- Niu Technologies' estimated fair value is US$2.30 based on 2 Stage Free Cash Flow to Equity
- Niu Technologies' US$1.71 share price signals that it might be 26% undervalued
- Analyst price target for NIU is CN¥4.33, which is 88% above our fair value estimate
Does the February share price for Niu Technologies (NASDAQ:NIU) reflect what it's really worth? Today, we will estimate the stock's intrinsic value by projecting its future cash flows and then discounting them to today's value. This will be done using the Discounted Cash Flow (DCF) model. Don't get put off by the jargon, the math behind it is actually quite straightforward.
We would caution that there are many ways of valuing a company and, like the DCF, each technique has advantages and disadvantages in certain scenarios. Anyone interested in learning a bit more about intrinsic value should have a read of the Simply Wall St analysis model.
Check out our latest analysis for Niu Technologies
The Calculation
We use what is known as a 2-stage model, which simply means we have two different periods of growth rates for the company's cash flows. Generally the first stage is higher growth, and the second stage is a lower growth phase. To start off with, we need to estimate the next ten years of cash flows. Where possible we use analyst estimates, but when these aren't available we extrapolate the previous free cash flow (FCF) from the last estimate or reported value. We assume companies with shrinking free cash flow will slow their rate of shrinkage, and that companies with growing free cash flow will see their growth rate slow, over this period. We do this to reflect that growth tends to slow more in the early years than it does in later years.
Generally we assume that a dollar today is more valuable than a dollar in the future, and so the sum of these future cash flows is then discounted to today's value:
10-year free cash flow (FCF) forecast
| 2024 | 2025 | 2026 | 2027 | 2028 | 2029 | 2030 | 2031 | 2032 | 2033 | |
| Levered FCF (CN¥, Millions) | CN¥81.0m | CN¥100.0m | CN¥114.2m | CN¥126.4m | CN¥136.6m | CN¥145.4m | CN¥152.9m | CN¥159.4m | CN¥165.3m | CN¥170.7m |
| Growth Rate Estimate Source | Analyst x1 | Analyst x1 | Est @ 14.22% | Est @ 10.64% | Est @ 8.13% | Est @ 6.38% | Est @ 5.15% | Est @ 4.29% | Est @ 3.69% | Est @ 3.27% |
| Present Value (CN¥, Millions) Discounted @ 12% | CN¥72.3 | CN¥79.6 | CN¥81.2 | CN¥80.1 | CN¥77.3 | CN¥73.4 | CN¥68.9 | CN¥64.1 | CN¥59.3 | CN¥54.7 |
("Est" = FCF growth rate estimated by Simply Wall St)
Present Value of 10-year Cash Flow (PVCF) = CN¥711m
We now need to calculate the Terminal Value, which accounts for all the future cash flows after this ten year period. For a number of reasons a very conservative growth rate is used that cannot exceed that of a country's GDP growth. In this case we have used the 5-year average of the 10-year government bond yield (2.3%) to estimate future growth. In the same way as with the 10-year 'growth' period, we discount future cash flows to today's value, using a cost of equity of 12%.
Terminal Value (TV)= FCF2033 × (1 + g) ÷ (r – g) = CN¥171m× (1 + 2.3%) ÷ (12%– 2.3%) = CN¥1.8b
Present Value of Terminal Value (PVTV)= TV / (1 + r)10= CN¥1.8b÷ ( 1 + 12%)10= CN¥572m
The total value, or equity value, is then the sum of the present value of the future cash flows, which in this case is CN¥1.3b. The last step is to then divide the equity value by the number of shares outstanding. Compared to the current share price of US$1.7, the company appears a touch undervalued at a 26% discount to where the stock price trades currently. Remember though, that this is just an approximate valuation, and like any complex formula - garbage in, garbage out.
Important Assumptions
Now the most important inputs to a discounted cash flow are the discount rate, and of course, the actual cash flows. You don't have to agree with these inputs, I recommend redoing the calculations yourself and playing with them. The DCF also does not consider the possible cyclicality of an industry, or a company's future capital requirements, so it does not give a full picture of a company's potential performance. Given that we are looking at Niu Technologies as potential shareholders, the cost of equity is used as the discount rate, rather than the cost of capital (or weighted average cost of capital, WACC) which accounts for debt. In this calculation we've used 12%, which is based on a levered beta of 1.736. Beta is a measure of a stock's volatility, compared to the market as a whole. We get our beta from the industry average beta of globally comparable companies, with an imposed limit between 0.8 and 2.0, which is a reasonable range for a stable business.
SWOT Analysis for Niu Technologies
- Debt is well covered by earnings.
- No major weaknesses identified for NIU.
- Expected to breakeven next year.
- Good value based on P/S ratio and estimated fair value.
- Debt is not well covered by operating cash flow.
Moving On:
Although the valuation of a company is important, it ideally won't be the sole piece of analysis you scrutinize for a company. It's not possible to obtain a foolproof valuation with a DCF model. Rather it should be seen as a guide to "what assumptions need to be true for this stock to be under/overvalued?" For instance, if the terminal value growth rate is adjusted slightly, it can dramatically alter the overall result. Can we work out why the company is trading at a discount to intrinsic value? For Niu Technologies, there are three further aspects you should look at:
- Financial Health: Does NIU have a healthy balance sheet? Take a look at our free balance sheet analysis with six simple checks on key factors like leverage and risk.
- Future Earnings: How does NIU's growth rate compare to its peers and the wider market? Dig deeper into the analyst consensus number for the upcoming years by interacting with our free analyst growth expectation chart.
- Other High Quality Alternatives: Do you like a good all-rounder? Explore our interactive list of high quality stocks to get an idea of what else is out there you may be missing!
PS. Simply Wall St updates its DCF calculation for every American stock every day, so if you want to find the intrinsic value of any other stock just search here.
Mobile Infrastructure for Defense and Disaster
The next wave in robotics isn't humanoid. Its fully autonomous towers delivering 5G, ISR, and radar in under 30 minutes, anywhere.
Get the investor briefing before the next round of contracts
Sponsored On Behalf of CiTechValuation is complex, but we're here to simplify it.
Discover if Niu Technologies might be undervalued or overvalued with our detailed analysis, featuring fair value estimates, potential risks, dividends, insider trades, and its financial condition.
Access Free AnalysisHave feedback on this article? Concerned about the content? Get in touch with us directly. Alternatively, email editorial-team (at) simplywallst.com.
This article by Simply Wall St is general in nature. We provide commentary based on historical data and analyst forecasts only using an unbiased methodology and our articles are not intended to be financial advice. It does not constitute a recommendation to buy or sell any stock, and does not take account of your objectives, or your financial situation. We aim to bring you long-term focused analysis driven by fundamental data. Note that our analysis may not factor in the latest price-sensitive company announcements or qualitative material. Simply Wall St has no position in any stocks mentioned.
About NasdaqGM:NIU
Niu Technologies
Designs, manufactures, and sells electric scooters in the People's Republic of China, Europe, and internationally.
Exceptional growth potential and good value.
Similar Companies
Market Insights

Weekly Picks

Early mover in a fast growing industry. Likely to experience share price volatility as they scale


A case for CA$31.80 (undiluted), aka 8,616% upside from CA$0.37 (an 86 bagger!).


Moderation and Stabilisation: HOLD: Fair Price based on a 4-year Cycle is $12.08
Recently Updated Narratives

Airbnb Stock: Platform Growth in a World of Saturation and Scrutiny

Clarivate Stock: When Data Becomes the Backbone of Innovation and Law

Adobe Stock: AI-Fueled ARR Growth Pushes Guidance Higher, But Cost Pressures Loom
Popular Narratives


Crazy Undervalued 42 Baggers Silver Play (Active & Running Mine)


NVDA: Expanding AI Demand Will Drive Major Data Center Investments Through 2026


MicroVision will explode future revenue by 380.37% with a vision towards success
Trending Discussion
