
Advertisement
- United States
- /
- Auto Components
- /
- NasdaqGS:GT
The Goodyear Tire & Rubber Company's (NASDAQ:GT) Intrinsic Value Is Potentially 30% Above Its Share Price
Key Insights
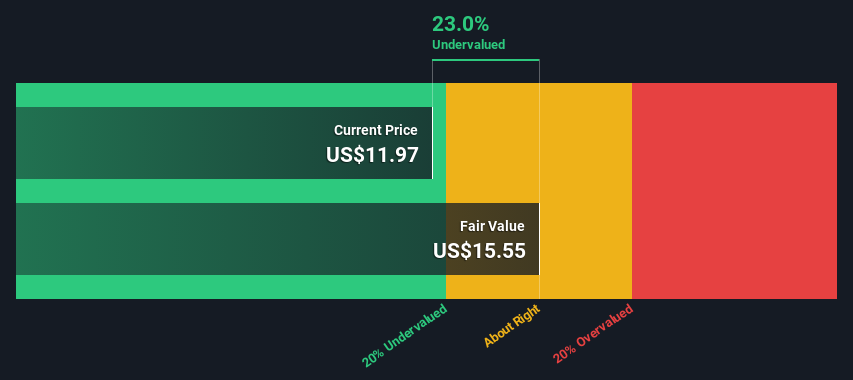
- Using the 2 Stage Free Cash Flow to Equity, Goodyear Tire & Rubber fair value estimate is US$15.55
- Goodyear Tire & Rubber is estimated to be 23% undervalued based on current share price of US$11.97
- Our fair value estimate is 8.5% higher than Goodyear Tire & Rubber's analyst price target of US$14.33
How far off is The Goodyear Tire & Rubber Company (NASDAQ:GT) from its intrinsic value? Using the most recent financial data, we'll take a look at whether the stock is fairly priced by taking the expected future cash flows and discounting them to today's value. This will be done using the Discounted Cash Flow (DCF) model. Before you think you won't be able to understand it, just read on! It's actually much less complex than you'd imagine.
We generally believe that a company's value is the present value of all of the cash it will generate in the future. However, a DCF is just one valuation metric among many, and it is not without flaws. If you still have some burning questions about this type of valuation, take a look at the Simply Wall St analysis model.
Check out our latest analysis for Goodyear Tire & Rubber
The Model
We use what is known as a 2-stage model, which simply means we have two different periods of growth rates for the company's cash flows. Generally the first stage is higher growth, and the second stage is a lower growth phase. In the first stage we need to estimate the cash flows to the business over the next ten years. Where possible we use analyst estimates, but when these aren't available we extrapolate the previous free cash flow (FCF) from the last estimate or reported value. We assume companies with shrinking free cash flow will slow their rate of shrinkage, and that companies with growing free cash flow will see their growth rate slow, over this period. We do this to reflect that growth tends to slow more in the early years than it does in later years.
A DCF is all about the idea that a dollar in the future is less valuable than a dollar today, so we discount the value of these future cash flows to their estimated value in today's dollars:
10-year free cash flow (FCF) estimate
| 2024 | 2025 | 2026 | 2027 | 2028 | 2029 | 2030 | 2031 | 2032 | 2033 | |
| Levered FCF ($, Millions) | US$90.7m | US$185.2m | US$268.1m | US$353.9m | US$435.5m | US$508.6m | US$571.5m | US$624.8m | US$669.6m | US$707.5m |
| Growth Rate Estimate Source | Analyst x1 | Analyst x1 | Est @ 44.79% | Est @ 32.00% | Est @ 23.04% | Est @ 16.77% | Est @ 12.39% | Est @ 9.32% | Est @ 7.17% | Est @ 5.66% |
| Present Value ($, Millions) Discounted @ 12% | US$80.9 | US$147 | US$190 | US$224 | US$245 | US$256 | US$256 | US$250 | US$239 | US$225 |
("Est" = FCF growth rate estimated by Simply Wall St)
Present Value of 10-year Cash Flow (PVCF) = US$2.1b
After calculating the present value of future cash flows in the initial 10-year period, we need to calculate the Terminal Value, which accounts for all future cash flows beyond the first stage. The Gordon Growth formula is used to calculate Terminal Value at a future annual growth rate equal to the 5-year average of the 10-year government bond yield of 2.2%. We discount the terminal cash flows to today's value at a cost of equity of 12%.
Terminal Value (TV)= FCF2033 × (1 + g) ÷ (r – g) = US$707m× (1 + 2.2%) ÷ (12%– 2.2%) = US$7.2b
Present Value of Terminal Value (PVTV)= TV / (1 + r)10= US$7.2b÷ ( 1 + 12%)10= US$2.3b
The total value is the sum of cash flows for the next ten years plus the discounted terminal value, which results in the Total Equity Value, which in this case is US$4.4b. In the final step we divide the equity value by the number of shares outstanding. Compared to the current share price of US$12.0, the company appears a touch undervalued at a 23% discount to where the stock price trades currently. The assumptions in any calculation have a big impact on the valuation, so it is better to view this as a rough estimate, not precise down to the last cent.
Important Assumptions
Now the most important inputs to a discounted cash flow are the discount rate, and of course, the actual cash flows. If you don't agree with these result, have a go at the calculation yourself and play with the assumptions. The DCF also does not consider the possible cyclicality of an industry, or a company's future capital requirements, so it does not give a full picture of a company's potential performance. Given that we are looking at Goodyear Tire & Rubber as potential shareholders, the cost of equity is used as the discount rate, rather than the cost of capital (or weighted average cost of capital, WACC) which accounts for debt. In this calculation we've used 12%, which is based on a levered beta of 2.000. Beta is a measure of a stock's volatility, compared to the market as a whole. We get our beta from the industry average beta of globally comparable companies, with an imposed limit between 0.8 and 2.0, which is a reasonable range for a stable business.
SWOT Analysis for Goodyear Tire & Rubber
Strength
- No major strengths identified for GT.
Weakness
- Interest payments on debt are not well covered.
Opportunity
- Expected to breakeven next year.
- Has sufficient cash runway for more than 3 years based on current free cash flows.
- Good value based on P/S ratio and estimated fair value.
Threat
- Debt is not well covered by operating cash flow.
Next Steps:
Valuation is only one side of the coin in terms of building your investment thesis, and it is only one of many factors that you need to assess for a company. The DCF model is not a perfect stock valuation tool. Instead the best use for a DCF model is to test certain assumptions and theories to see if they would lead to the company being undervalued or overvalued. For example, changes in the company's cost of equity or the risk free rate can significantly impact the valuation. What is the reason for the share price sitting below the intrinsic value? For Goodyear Tire & Rubber, there are three further factors you should look at:
- Risks: Case in point, we've spotted 1 warning sign for Goodyear Tire & Rubber you should be aware of.
- Future Earnings: How does GT's growth rate compare to its peers and the wider market? Dig deeper into the analyst consensus number for the upcoming years by interacting with our free analyst growth expectation chart.
- Other High Quality Alternatives: Do you like a good all-rounder? Explore our interactive list of high quality stocks to get an idea of what else is out there you may be missing!
PS. The Simply Wall St app conducts a discounted cash flow valuation for every stock on the NASDAQGS every day. If you want to find the calculation for other stocks just search here.
New: Manage All Your Stock Portfolios in One Place
We've created the ultimate portfolio companion for stock investors, and it's free.
• Connect an unlimited number of Portfolios and see your total in one currency
• Be alerted to new Warning Signs or Risks via email or mobile
• Track the Fair Value of your stocks
Have feedback on this article? Concerned about the content? Get in touch with us directly. Alternatively, email editorial-team (at) simplywallst.com.
This article by Simply Wall St is general in nature. We provide commentary based on historical data and analyst forecasts only using an unbiased methodology and our articles are not intended to be financial advice. It does not constitute a recommendation to buy or sell any stock, and does not take account of your objectives, or your financial situation. We aim to bring you long-term focused analysis driven by fundamental data. Note that our analysis may not factor in the latest price-sensitive company announcements or qualitative material. Simply Wall St has no position in any stocks mentioned.
About NasdaqGS:GT
Goodyear Tire & Rubber
Develops, manufactures, distributes, and sells tires and related products and services worldwide.
Undervalued with moderate growth potential.
Similar Companies
Market Insights

Advertisement
Community Narratives
WhiteCap Is Positioned To Profit Regardless Of Trump's Policy 
Fair Value CA$22.60|61.5% undervalued
ST
Equity Analyst and Writer
Microsoft's Evolution Will Drive Revenue to New Heights Fueled by AI
Fair Value US$360.00|30.7% overvalued
BR
Community Contributor
A CASE FOR USD$2.50 (CAD$3.44) BY 2028 (A 5-10 BAGGER)
Fair Value CA$3.44|88.1% undervalued
AG
Community Contributor